

Answered step by step
Verified Expert Solution
Question
1 Approved Answer
A graph of unit volume and cost data is called a: Multiple Choice O O O O Least-squares diagram. Step-wise diagram. Scatter diagram. Break-even diagram.
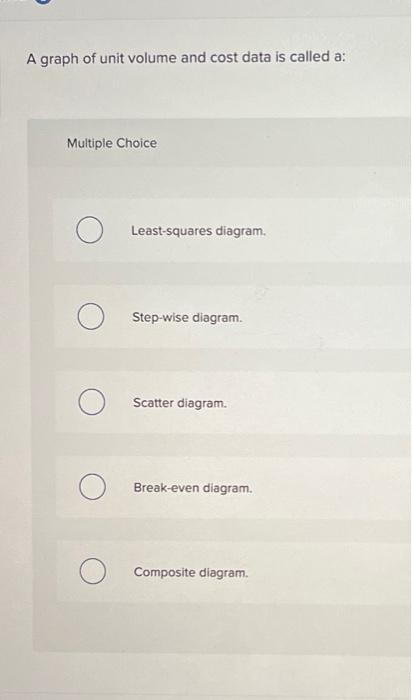
A graph of unit volume and cost data is called a: Multiple Choice O O O O Least-squares diagram. Step-wise diagram. Scatter diagram. Break-even diagram. Composite diagram.
Step by Step Solution
There are 3 Steps involved in it
Step: 1

Get Instant Access to Expert-Tailored Solutions
See step-by-step solutions with expert insights and AI powered tools for academic success
Step: 2

Step: 3
Ace Your Homework with AI
Get the answers you need in no time with our AI-driven, step-by-step assistance
Get Started
Frank Woods Business Accounting Volume 2
Authors: Frank Wood, Alan Sangster
14th Edition
1292209178, 9781292209173