(a) Graph the Efficient Frontier for only 2 assets, AOL and TWA. Use the formula
VAR(aX + bY) = a2VAR(X) + b2VAR(Y) +2abCOV(X,Y).
Recall a + b=1 since this is a 2-asset portfolio.
(b) What is the Minimum Variance portfolio? Identify by weight in each asset.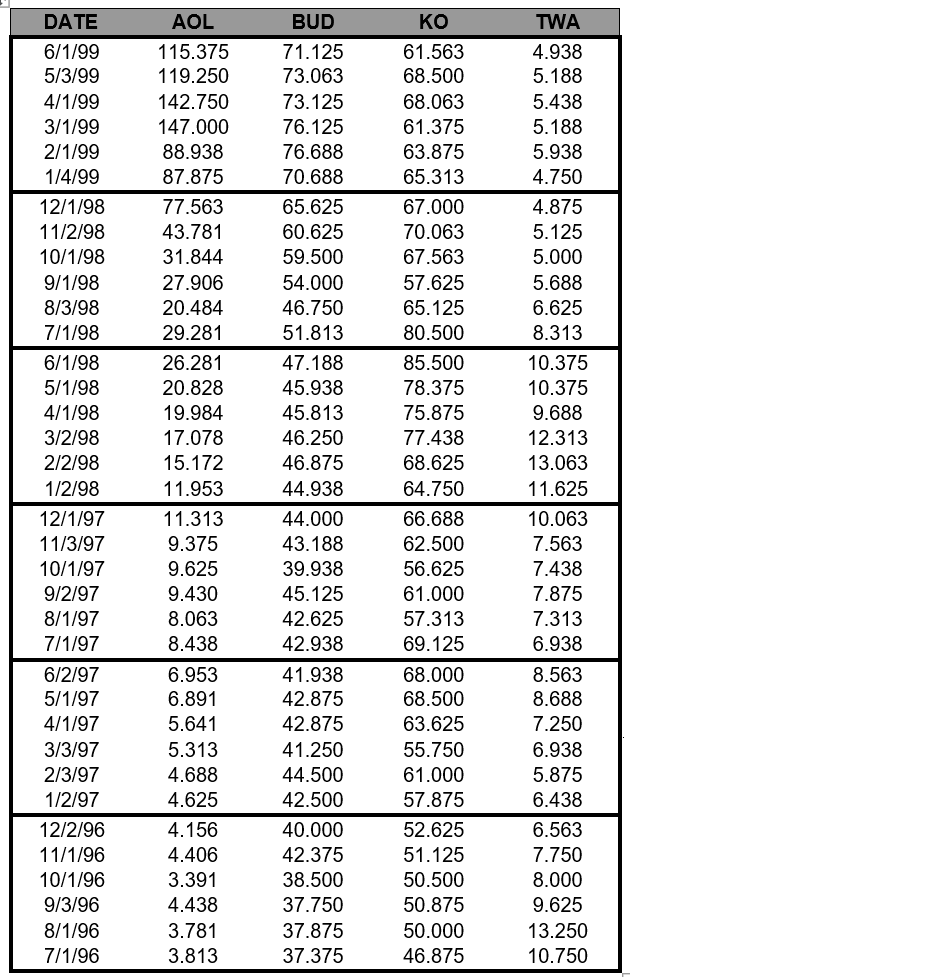
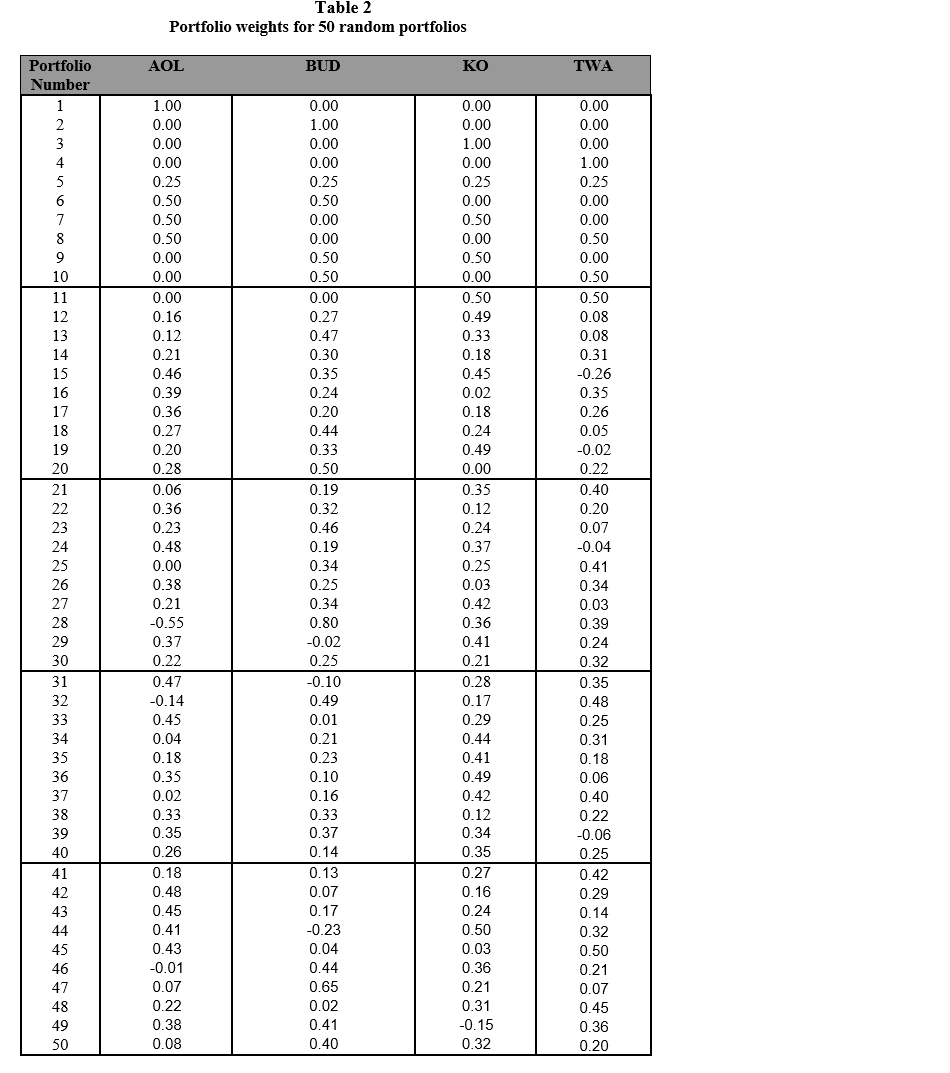
DATE AOL BUD KO TWA 6/1/99 5/3/99 115.375 119.250 71.125 73.063 61.563 68.500 68.063 61.375 4/1/99 3/1/99 2/1/99 1/4/99 142.750 147.000 88.938 87.875 73.125 76.125 76.688 70.688 4.938 5.188 5.438 5.188 5.938 4.750 63.875 65.313 77.563 43.781 31.844 67.000 70.063 67.563 12/1/98 11/2/98 10/1/98 9/1/98 8/3/98 7/1/98 65.625 60.625 59.500 54.000 46.750 51.813 4.875 5.125 5.000 5.688 6.625 8.313 27.906 20.484 29.281 57.625 65.125 80.500 6/1/98 5/1/98 4/1/98 3/2/98 2/2/98 1/2/98 26.281 20.828 19.984 17.078 172 47.188 45.938 45.813 46.250 46.875 44.938 85.500 78.375 75.875 77.438 68.625 64.750 10.375 10.375 9.688 12.313 13.063 11.625 11.953 12/1/97 11/3/97 10/1/97 9/2/97 8/1/97 7/1/97 11.313 9.375 9.625 9.430 8.063 8.438 44.000 43.188 39.938 45.125 42.625 42.938 66.688 62.500 56.625 61.000 57.313 10.063 7.563 7.438 7.875 7.313 6.938 69.125 6/2/97 5/1/97 4/1/97 41.938 42.875 42.875 68.000 68.500 63.625 6.953 6.891 5.641 5.313 4.688 4.625 8.563 8.688 7.250 6.938 5.875 6.438 3/3/97 2/3/97 1/2/97 41.250 44.500 42.500 55.750 61.000 57.875 12/2/96 11/1/96 10/1/96 9/3/96 8/1/96 7/1/96 4.156 4.406 3.391 4.438 3.781 3.813 40.000 42.375 38.500 37.750 37.875 52.625 51.125 50.500 50.875 50.000 46.875 6.563 7.750 8.000 9.625 13.250 10.750 37.375 Table 2 Portfolio weights for 50 random portfolios AOL BUD KO TWA Portfolio Number 1 1.00 0.00 0.00 0.00 2 0.00 0.00 0.00 0.00 0.00 1.00 0.00 1.00 0.25 0.00 0.25 0.50 0.50 1.00 0.00 0.00 0.25 0.50 0.00 0.00 0.50 0.50 0.25 0.00 0.00 7 0.50 0.00 8 0.50 0.00 0.50 9 0.50 0.00 0.00 0.00 0.50 10 0.00 11 0.00 0.00 0.50 0.50 12 0.16 0.27 0.49 0.08 0.08 13 0.12 0.47 0.33 14 0.30 0.18 0.31 15 0.45 -0.26 0.21 0.46 0.39 0.36 16 0.02 0.35 17 0.18 0.26 0.35 0.24 0.20 0.44 0.33 0.50 18 0.27 0.24 19 0.20 0.49 0.00 0.05 -0.02 0.22 20 0.28 21 0.19 0.35 0.40 22 0.06 0.36 0.23 0.32 0.12 0.20 23 0.24 0.07 0.46 0.19 24 0.48 0.37 -0.04 25 0.34 0.25 0.41 0.00 0.38 26 0.25 0.03 0.34 27 0.21 0.34 0.42 0.03 0.36 28 29 30 -0.55 0.37 0.22 0.80 -0.02 0.25 0.41 0.39 0.24 0.32 0.21 31 0.47 0.28 -0.10 0.49 32 -0.14 0.17 0.35 0.48 0.25 0.31 33 0.01 0.29 34 0.21 0.44 35 0.23 0.41 0.18 36 0.10 0.49 0.06 0.45 0.04 0.18 0.35 0.02 0.33 0.35 0.26 37 0.42 0.40 38 39 0.16 0.33 0.37 0.12 0.34 0.22 -0.06 0.25 40 0.14 0.35 41 0.13 0.27 0.42 0.29 42 0.16 43 0.24 0.14 0.07 0.17 -0.23 0.04 44 0.50 0.18 0.48 0.45 0.41 0.43 -0.01 0.07 0.22 0.32 45 0.03 0.50 46 0.44 0.36 0.21 47 0.65 0.21 0.07 48 0.45 0.02 0.41 49 0.38 0.31 -0.15 0.32 0.36 50 0.08 0.40 0.20 DATE AOL BUD KO TWA 6/1/99 5/3/99 115.375 119.250 71.125 73.063 61.563 68.500 68.063 61.375 4/1/99 3/1/99 2/1/99 1/4/99 142.750 147.000 88.938 87.875 73.125 76.125 76.688 70.688 4.938 5.188 5.438 5.188 5.938 4.750 63.875 65.313 77.563 43.781 31.844 67.000 70.063 67.563 12/1/98 11/2/98 10/1/98 9/1/98 8/3/98 7/1/98 65.625 60.625 59.500 54.000 46.750 51.813 4.875 5.125 5.000 5.688 6.625 8.313 27.906 20.484 29.281 57.625 65.125 80.500 6/1/98 5/1/98 4/1/98 3/2/98 2/2/98 1/2/98 26.281 20.828 19.984 17.078 172 47.188 45.938 45.813 46.250 46.875 44.938 85.500 78.375 75.875 77.438 68.625 64.750 10.375 10.375 9.688 12.313 13.063 11.625 11.953 12/1/97 11/3/97 10/1/97 9/2/97 8/1/97 7/1/97 11.313 9.375 9.625 9.430 8.063 8.438 44.000 43.188 39.938 45.125 42.625 42.938 66.688 62.500 56.625 61.000 57.313 10.063 7.563 7.438 7.875 7.313 6.938 69.125 6/2/97 5/1/97 4/1/97 41.938 42.875 42.875 68.000 68.500 63.625 6.953 6.891 5.641 5.313 4.688 4.625 8.563 8.688 7.250 6.938 5.875 6.438 3/3/97 2/3/97 1/2/97 41.250 44.500 42.500 55.750 61.000 57.875 12/2/96 11/1/96 10/1/96 9/3/96 8/1/96 7/1/96 4.156 4.406 3.391 4.438 3.781 3.813 40.000 42.375 38.500 37.750 37.875 52.625 51.125 50.500 50.875 50.000 46.875 6.563 7.750 8.000 9.625 13.250 10.750 37.375 Table 2 Portfolio weights for 50 random portfolios AOL BUD KO TWA Portfolio Number 1 1.00 0.00 0.00 0.00 2 0.00 0.00 0.00 0.00 0.00 1.00 0.00 1.00 0.25 0.00 0.25 0.50 0.50 1.00 0.00 0.00 0.25 0.50 0.00 0.00 0.50 0.50 0.25 0.00 0.00 7 0.50 0.00 8 0.50 0.00 0.50 9 0.50 0.00 0.00 0.00 0.50 10 0.00 11 0.00 0.00 0.50 0.50 12 0.16 0.27 0.49 0.08 0.08 13 0.12 0.47 0.33 14 0.30 0.18 0.31 15 0.45 -0.26 0.21 0.46 0.39 0.36 16 0.02 0.35 17 0.18 0.26 0.35 0.24 0.20 0.44 0.33 0.50 18 0.27 0.24 19 0.20 0.49 0.00 0.05 -0.02 0.22 20 0.28 21 0.19 0.35 0.40 22 0.06 0.36 0.23 0.32 0.12 0.20 23 0.24 0.07 0.46 0.19 24 0.48 0.37 -0.04 25 0.34 0.25 0.41 0.00 0.38 26 0.25 0.03 0.34 27 0.21 0.34 0.42 0.03 0.36 28 29 30 -0.55 0.37 0.22 0.80 -0.02 0.25 0.41 0.39 0.24 0.32 0.21 31 0.47 0.28 -0.10 0.49 32 -0.14 0.17 0.35 0.48 0.25 0.31 33 0.01 0.29 34 0.21 0.44 35 0.23 0.41 0.18 36 0.10 0.49 0.06 0.45 0.04 0.18 0.35 0.02 0.33 0.35 0.26 37 0.42 0.40 38 39 0.16 0.33 0.37 0.12 0.34 0.22 -0.06 0.25 40 0.14 0.35 41 0.13 0.27 0.42 0.29 42 0.16 43 0.24 0.14 0.07 0.17 -0.23 0.04 44 0.50 0.18 0.48 0.45 0.41 0.43 -0.01 0.07 0.22 0.32 45 0.03 0.50 46 0.44 0.36 0.21 47 0.65 0.21 0.07 48 0.45 0.02 0.41 49 0.38 0.31 -0.15 0.32 0.36 50 0.08 0.40 0.20