Question
A hospital just can't afford to operate a department at 50 percent capacity. If we average 20 dialysis patients, it costs us $425 per treatment,
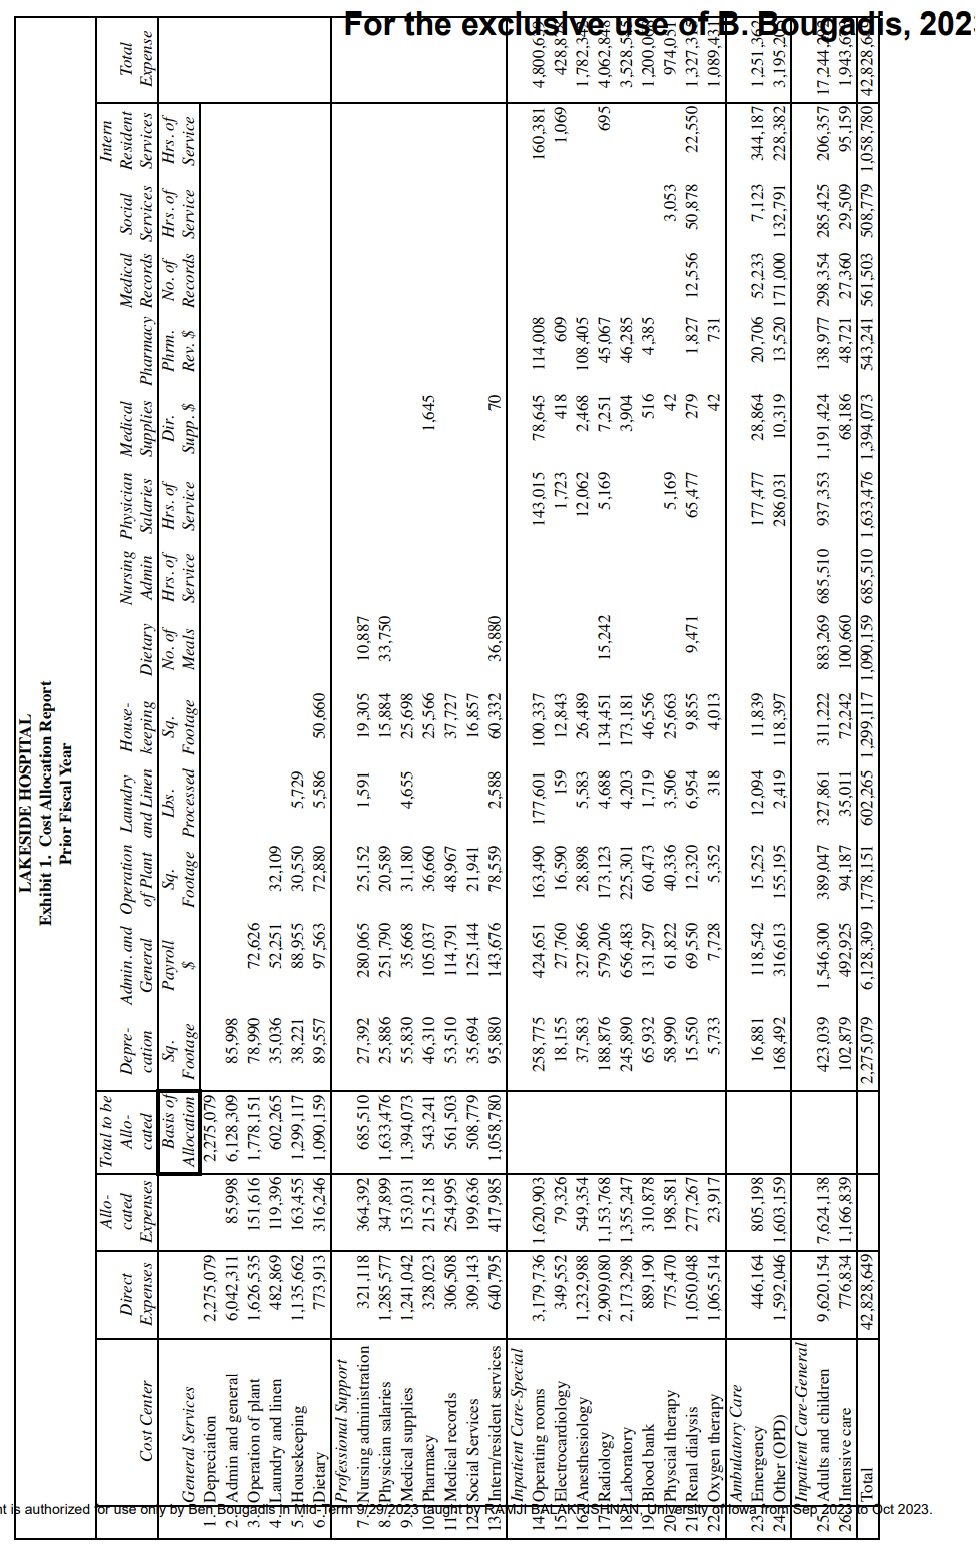
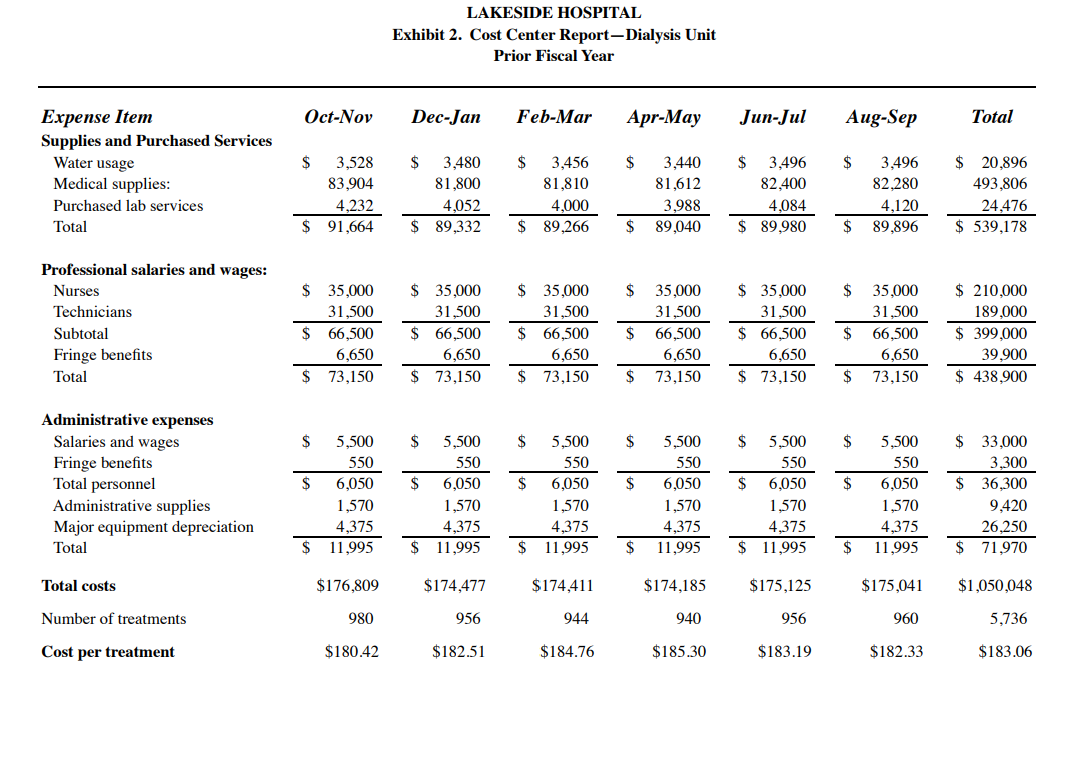
A hospital just can't afford to operate a department at 50 percent capacity. If we average 20 dialysis patients, it costs us $425 per treatment, and we're only paid $250. If a department can't cover its costs, including a fair share of overhead, it isn't self-sufficient and I don't think we should carry it. Peter Lawrence, M.D., Director of Specialty Services at Lakeside Hospital, was addressing James Newell, M.D., Chief Nephrologist of Lakeside's Renal Division, concerning a change in Medicare's payment policies for hemodialysis treatments. Recently, Medicare had begun paying independent dialysis clinics for standard dialysis treatments, and the change in policy had caused patient volume in Lakeside's dialysis unit to decrease to about 50 percent of capacity. they offered psychological advantages to patients. Centrally managed with low overhead, they could achieve economies unobtainable by similar hospital units. Supplies and equipment were purchased in bulk, for example, and administrators watched staff scheduling and other costs closely. As a result, their per treatment costs were significantly lower than those in a hospital facility. For example, a treatment in a center operating at 100 percent capacity with 40 patients could cost as little as $160. LAKESIDE DATA Lakeside's direct and allocated costs for the Renal Dialysis Unit in the previous fiscal year are detailed in Exhibit 1. Dr. Newell also obtained the unit's cost center report for the same fiscal year (Exhibit 2), which provided a breakdown of the unit's direct costs. Dr. Newell intended to use the prior year's costs to calculate the per-treatment cost at various volume levels for the current year. He also wanted to find the point at which the unit's revenue would meet its costs. He commented: I plan to use only those costs that can be traced directly to dialysis treatments, and not any overhead costs. If the unit's revenue meets its direct costs, it is self-sufficient. Peter's treatment cost of $425 is misleading since it includes substantial overhead, and this year's overhead will differ from last year's because of the unit's decrease in volume. Also, even though this year's overhead can't be calculated until the end of the fiscal year, I think I can come up with an estimate. First, though, I plan to calculate the "real" cost of a treatment and, from there, define a fair share" of overhead. In reviewing the cost center report, Dr. Newell realized that the nature of the costs varied. There are three types of costs I need to consider in this analysis: those that vary in proportion to volume, those that vary with significant changes in volume, and those that remain the same regardless of the unit's volume. The first and the last are pretty clear. Medical supplies, purchased laboratory services, and water usage all change according to the number of treatments provided. The other non-personnel expenses will stay essentially the same regardless of the number of treatments. Salary and wages, and employee expense costs are more complicated. Although they didn't change during the last year, the unit's number of treatments also remained fairly steady. However, the significant reduction in volume this year might cause a corresponding reduction in salary and employee expenses. Last year, we employed seven hemodialysis technicians, seven nurses, and one administrator (our nephrologists are all on the hospitals' physicians' payroll). However, since I had anticipated that volume would fall, I didn't replace the nurse and two technicians who left in January of this year. So, as of February, our annualized salaries have decreased by $84,000 and our fringe benefits have decreased by $8,400, for a total of about $92,400. Finally, just as a precaution, in case Peter asks, I had my secretary call a hospital equipment supply manufacturer to discuss the resale value of our 14 machines. They told her that machines used for four years or more could not be sold, even for scrap. We purchased all 14 machines five years ago for $210,000. 

Questions:
1. From the viewpoint of the dialysis unit (i.e., considering the unit's income statement), what is the contribution from the available options? To keep things manageable, begin by looking only at direct costs. Compute the surplus over direct costs as an intermediate step. Next, layer in allocated service costs. Which, if any, of these allocated costs should be considered for determining the contribution under various options, from the unit's perspective? For simplicity and to reduce computational burden, please do not recompute rates for changes in driver volumes; rather use the same rates as in Exhibit 1. A table such as the one below might help present the results succinctly. (As needed, please provide detail for each line in a larger table in the appendix).
| Option 1 | Option 2 | Option 3 (etc) | |
| Patient volume | |||
| Revenue | |||
| Direct costs | |||
| Surplus over direct costs | |||
| "Relevant" service costs | |||
| Contribution toward hospital fixed costs and profit |
2. What qualitative considerations might the unit advance to advocate for keeping it open? A bulleted list, with a short description of each factor, is enough.
3. Switch to the hospital's perspective. Should the hospital consider the same values as in (1) for its decision making? Direct costs are obviously treated identically. Focusing on allocated service costs, would the costs that the dialysis unit considers relevant for computing its contribution (and thus, the right decision metric from their view) also be considered relevant by the hospital for its decision making? If yes, why? If not, what changes? (There is not enough data to compute exact numbers. Thus, a description of how the change in perspective alters how we should think about the costs is enough.)
4. Note that the dialysis unit is using up some capacity. How should the hospital factor in the cost of this capacity? Again, we do not have data to come up with exact numbers, so a succinct description of plausible alternatives and their impact is enough.
\begin{tabular}{|c|c|c|c|c|c|c|c|c|c|c|c|c|c|c|c|c|c|c|} \hline & & & & & & & LAKESExhibit1.CPrio & SIDEHOSFCostAllocatiorFiscalYe & PITALtionReporear & & & & & & & & & \\ \hline gq & Cost Center & DirectExpenses & Allo-catedExpenses & \begin{tabular}{|c|} TotaltobeAllo-cated \\ \end{tabular} & Depre-cation & Admin.andGeneral & OperationofPlant & LaundryandLinen & House-keeping & Dietary & NursingAdmin & PhysicianSalaries & MedicalSupplies & Pharmacy & MedicalRecords & SocialServices & \begin{tabular}{c|} Intern \\ Resident \\ Services \end{tabular} & TotalExpense \\ \hline & General Services & & & BasisofAllocation & Sq.Footage & Payroll$ & Sq.Footage & Lbs.Processed & Sq.Footage & No.ofMeals & Hrs.ofService & Hrs.ofService & Dir.Supp.$ & Phrm.Rev.$ & No.ofRecords & Hrs.ofService & Hrs.ofService & \\ \hline 1.3 & Depreciation & 2,275,079 & & 2,275,079 & & & & & & & & & & & & & & \\ \hline 2. & Admin and general & 6,042,311 & 85,998 & 6,128,309 & 85,998 & & & & & & & & & & & & & \\ \hline 3. & Operation of plant & 1,626,535 & 151,616 & 1,778,151 & 78,990 & 72,626 & & & & & & & & & & & & \\ \hline 4. & Laundry and linen & 482,869 & 119,396 & 602,265 & 35,036 & 52,251 & 32,109 & & & & & & & & & & & \\ \hline 5. & Housekeeping & 1,135,662 & 163,455 & 1,299,117 & 38,221 & 88,955 & 30,550 & 5,729 & & & & & & & & & & \\ \hline 6. & Dietary & 773,913 & 316,246 & 1,090,159 & 89,557 & 97,563 & 72,880 & 5,586 & 50,660 & & & & & & & & & \\ \hline 7. & ProfessionalSupportNursingadministration & 321,118 & 364,392 & 685,510 & 27,392 & 280,065 & 25,152 & 1,591 & 19,305 & 10,887 & & & & & & & & \\ \hline 8.A & Physician salaries & 1,285,577 & 347,899 & 1,633,476 & 25,886 & 251,790 & 20,589 & & 15,884 & 33,750 & & & & & & & & \\ \hline 9. & Medical supplies & 1,241,042 & 153,031 & 1,394,073 & 55,830 & 35,668 & 31,180 & 4,655 & 25,698 & & & & & & & & & \\ \hline 10 a & Pharmacy & 328,023 & 215,218 & 543,241 & 46,310 & 105,037 & 36,660 & & 25,566 & & & & 1,645 & & & & & \\ \hline 11 & Medical records & 306,508 & 254,995 & 561,503 & 53,510 & 114,791 & 48,967 & & 37,727 & & & & & & & & & \\ \hline 12 & Social Services & 309,143 & 199,636 & 508,779 & 35,694 & 125,144 & 21,941 & & 16,857 & & & & & & & & & \\ \hline 13 & Intern/resident services & 640,795 & 417,985 & 1,058,780 & 95,880 & 143,676 & 78,559 & 2,588 & 60,332 & 36,880 & & & 70 & & & & & \\ \hline 14 & InpatientCare-SpecialOperatingrooms & 3,179,736 & 1,620,903 & & 258,775 & 424,651 & 163,490 & 177,601 & 100,337 & & & 143,015 & 78,645 & 114,008 & & & 160,381 & 4,800,6 \\ \hline 15 & Electrocardiology & 349,552 & 79,326 & & 18,155 & 27,760 & 16,590 & 159 & 12,843 & & & 1,723 & 418 & 609 & & & 1,069 & 428,8 \\ \hline 16 & Anesthesiology & 1,232,988 & 549,354 & & 37,583 & 327,866 & 28,898 & 5,583 & 26,489 & & & 12,062 & 2,468 & 108,405 & & & & 1,782,3 \\ \hline 17 & Radiology & 2,909,080 & 1,153,768 & & 188,876 & 579,206 & 173,123 & 4,688 & 134,451 & 15,242 & & 5,169 & 7,251 & 45,067 & & & 695 & 4,062,8 \\ \hline 1849 & Laboratory & 2,173,298 & 1,355,247 & & 245,890 & 656,483 & 225,301 & 4,203 & 173,181 & & & & 3,904 & 46,285 & & & & 3,528,5 \\ \hline & Blood bank & 889,190 & 310,878 & & 65,932 & 131,297 & 60,473 & 1,719 & 46,556 & & & & 516 & 4,385 & & & & 1,200,0 \\ \hline 20 & Physcial therapy & 775,470 & 198,581 & & 58,990 & 61,822 & 40,336 & 3,506 & 25,663 & & & 5,169 & 42 & & & 3,053 & & 974,05 \\ \hline 219 & Renal dialysis & 1,050,048 & 277,267 & & 15,550 & 69,550 & 12,320 & 6,954 & 9,855 & 9,471 & & 65,477 & 279 & 1,827 & 12,556 & 50,878 & 22,550 & 1,327,3 \\ \hline 22d & Oxygen therapy & 1,065,514 & 23,917 & & 5,733 & 7,728 & 5,352 & 318 & 4,013 & & & & 42 & 731 & & & & 1,089,4 \\ \hline 23 & AmbulatoryCareEmergency & 446,164 & 805,198 & & 16,881 & 118,542 & 15,252 & 12,094 & 11,839 & & & 177,477 & 28,864 & 20,706 & 52,233 & 7,123 & 344,187 & 1,251,3 \\ \hline 24 & Other (OPD) & 1,592,046 & 1,603,159 & & 168,492 & 316,613 & 155,195 & 2,419 & 118,397 & & & 286,031 & 10,319 & 13,520 & 171,000 & 132,791 & 228,382 & 3,195,2 \\ \hline 25 a & InpatientCare-GeneralAdultsandchildren & 9,620,154 & 7,624,138 & & 423,039 & 1,546,300 & 389,047 & 327,861 & 311,222 & 883,269 & 685,510 & 937,353 & 1,191,424 & 138,977 & 298,354 & 285,425 & 206,357 & 17,244,x \\ \hline 26 & Intensive care & 776,834 & 1,166,839 & & 102,879 & 492,925 & 94,187 & 35,011 & 72,242 & 100,660 & & & 68,186 & 48,721 & 27,360 & 29,509 & 95,159 & 1,943,60 \\ \hline d & Total & \begin{tabular}{|l|} 42,828,649 \\ \end{tabular} & & & 2,275,079 & 6,128,309 & 1,778,151 & 602,265 & 1,299,117 & 1,090,159 & 685,510 & 1,633,476 & 1,394,073 & 543,241 & 561,503 & 508,779 & 1,058,780 & 42,828,6c \\ \hline \end{tabular} LAKESIDE HOSPITAL Exhibit 2. Cost Center Report-Dialysis Unit Prior Fiscal YearStep by Step Solution
There are 3 Steps involved in it
Step: 1

Get Instant Access to Expert-Tailored Solutions
See step-by-step solutions with expert insights and AI powered tools for academic success
Step: 2

Step: 3

Ace Your Homework with AI
Get the answers you need in no time with our AI-driven, step-by-step assistance
Get Started


