

Question
A hospital would like to develop a regression model to predict the total hospital bill for a patient based on the age of the patient
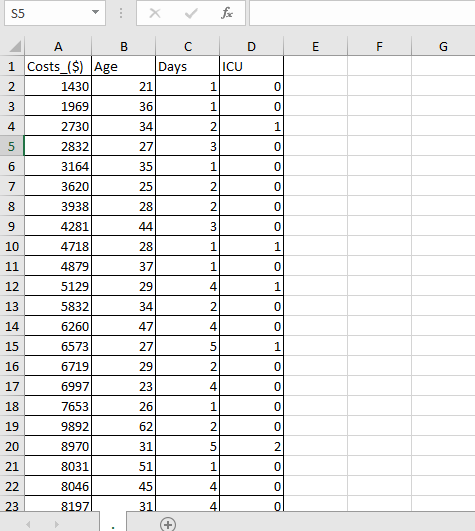
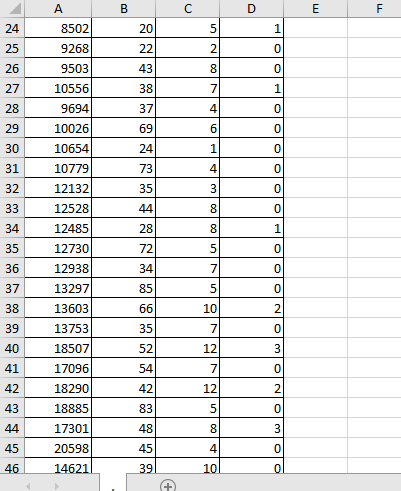
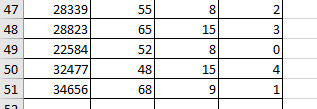
A hospital would like to develop a regression model to predict the total hospital bill for a patient based on the age of the patient (x1), his or her length of stay (x2), and the number of days in the hospital's intensive care unit(ICU) (x3). Data for these variables can be found below. Complete parts a through e below.
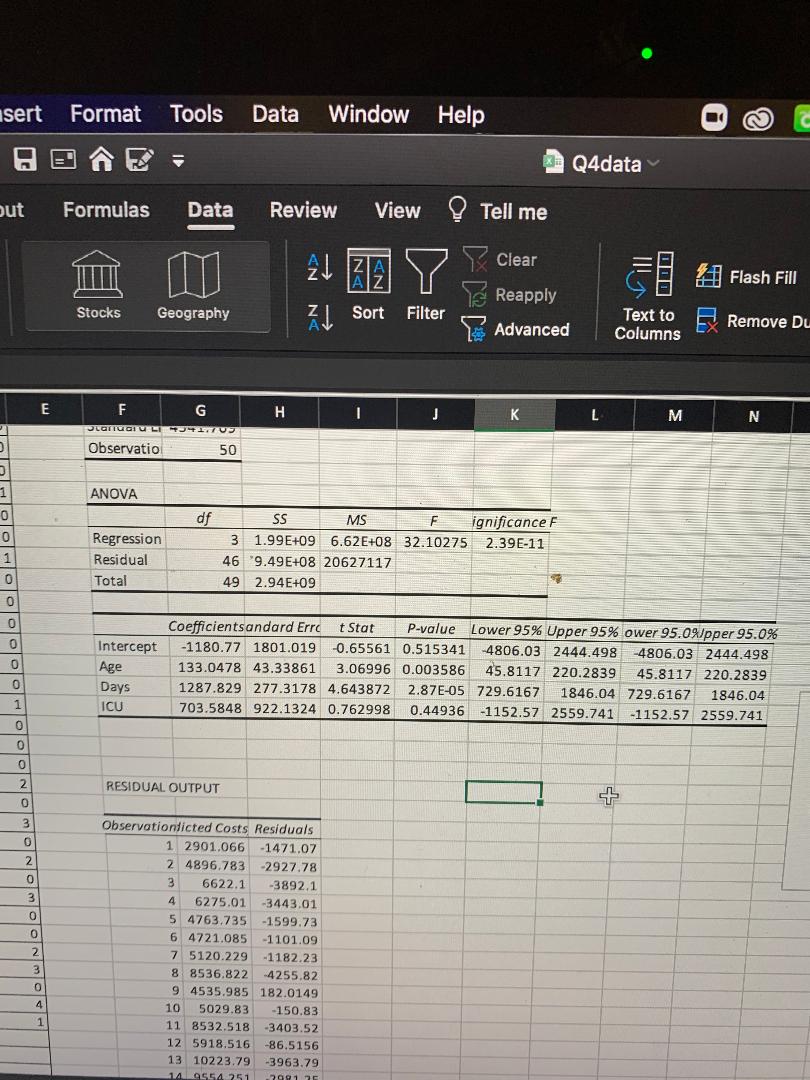
a) Construct a regression model using all three independent variables. (Round to the nearest whole number as needed.)
b) Interpret the meaning of the regression coefficients.
c) Predict the average hospital bill for a 69-year-old person hospitalized for ten days with no days spent in the ICU. (Round to the nearest dollar as needed.)
d) Construct a 95% confidence interval for the average hospital bill for the patient described in part c. (Round to the nearest dollar as needed.)
e) Construct a 95% prediction interval for the average hospital bill for the patient described in part c, that is, a 69-year-old person hospitalized for ten days with no days spent in the ICU. (Round to the nearest dollar as needed.)
Below is the excel table given.
Thank you!! (:
Step by Step Solution
There are 3 Steps involved in it
Step: 1

Get Instant Access to Expert-Tailored Solutions
See step-by-step solutions with expert insights and AI powered tools for academic success
Step: 2

Step: 3
Ace Your Homework with AI
Get the answers you need in no time with our AI-driven, step-by-step assistance
Get Started
College Algebra Graphs and Models
Authors: Marvin L. Bittinger, Judith A. Beecher, David J. Ellenbogen, Judith A. Penna
5th edition
321845404, 978-0321791009, 321791002, 978-0321783950, 321783956, 978-0321845405