Answered step by step
Verified Expert Solution
Question
1 Approved Answer
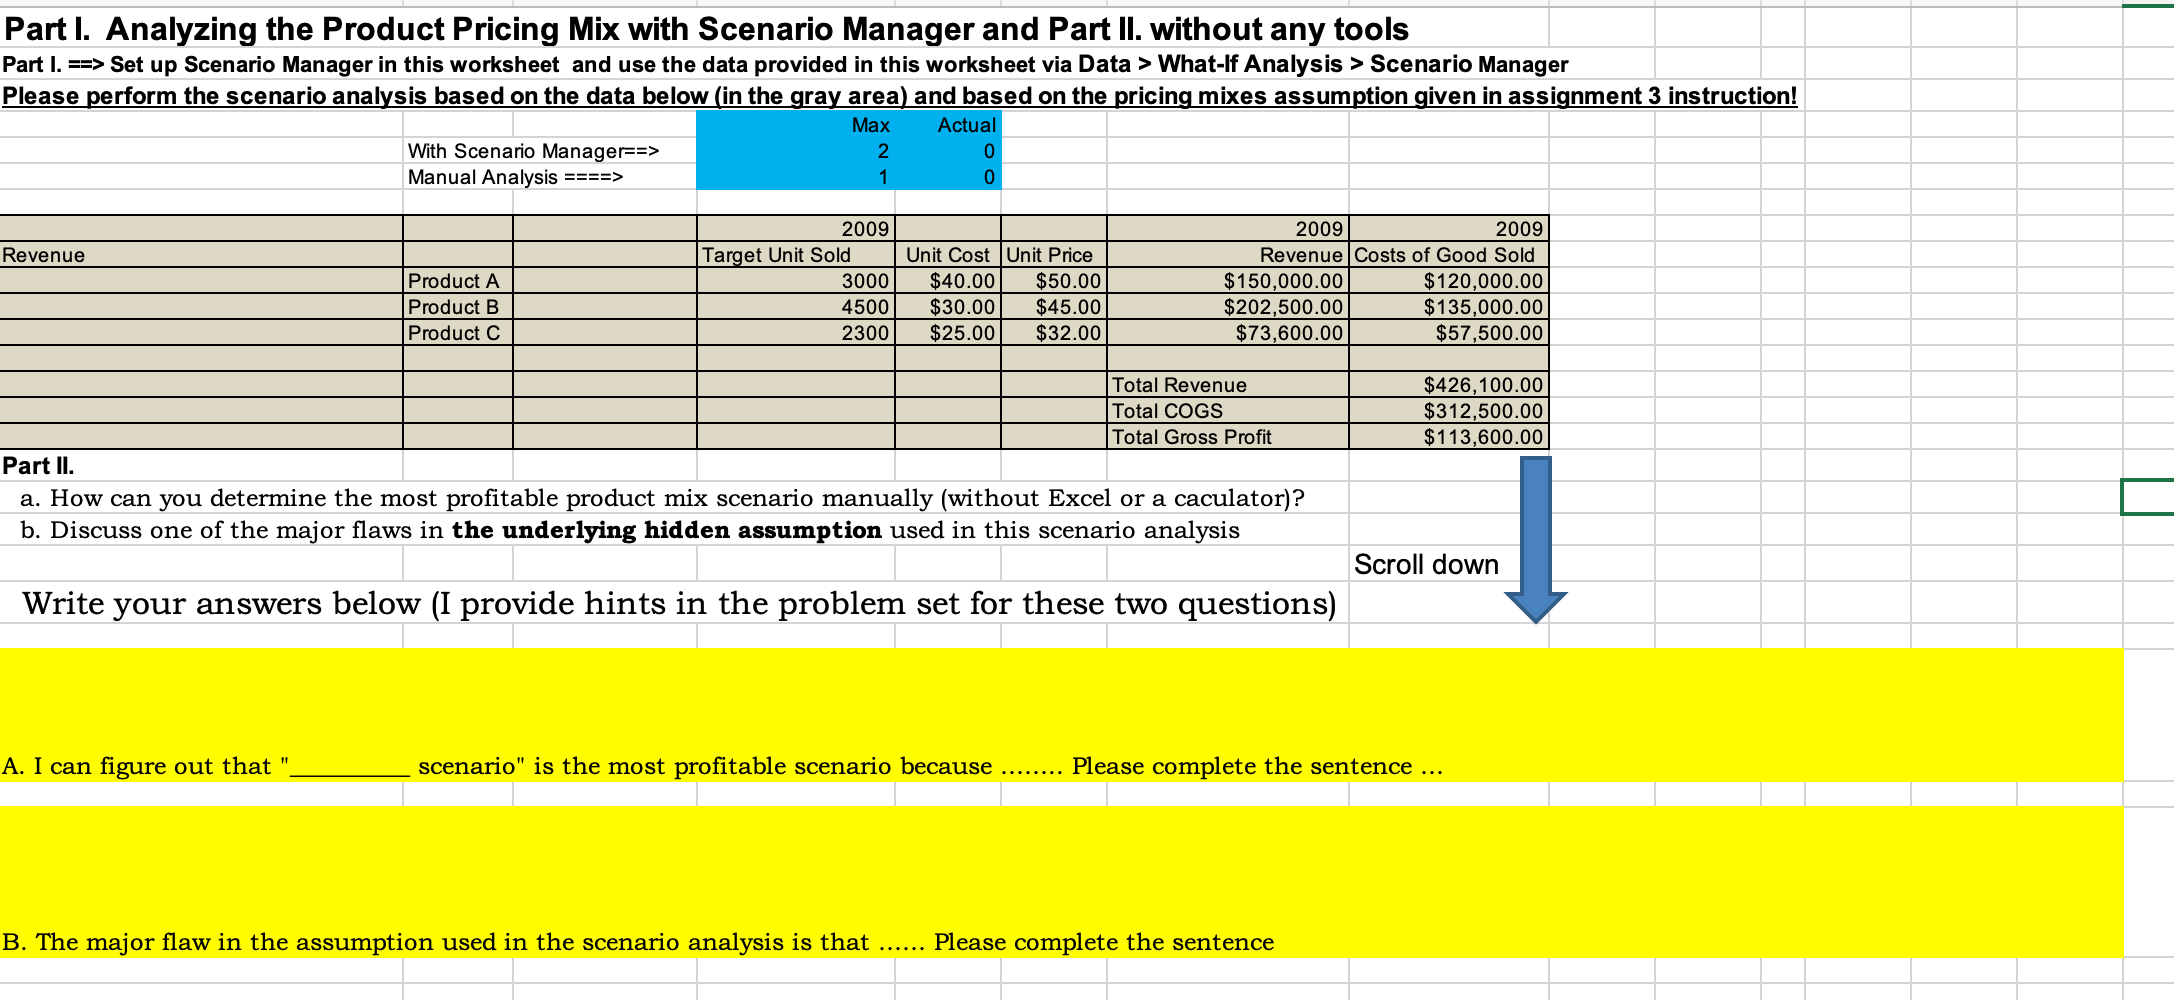
a. How can you determine the most profitable product mix scenario manually (without Excel or a caculator)? b. Discuss one of the major flaws in
 a. How can you determine the most profitable product mix scenario manually (without Excel or a caculator)?
b. Discuss one of the major flaws in the underlying hidden assumption used in this scenario analysis
Part I. Analyzing the Product Pricing Mix with Scenario Manager and Part II. without any tools Part I. ==> Set up Scenario Manager in this worksheet and use the data provided in this worksheet via Data > What-lf Analysis > Scenario Manager Please perform the scenario analysis based on the data below in the gray area) and based on the pricing mixes assumption given in assignment 3 instruction! With Scenario Manager==> Manual Analysis ====> Max 2 1 Actual 0 0 Revenue Product A Product B Product C 2009 Target Unit Sold 3000 4500 2300 Unit Cost Unit Price $40.00 $50.00 $30.00 $45.00 $25.00 $32.00 2009 2009 Revenue Costs of Good Sold $150,000.00 $120,000.00 $202,500.00 $135,000.00 $73,600.00 $57,500.00 $426,100.00 $312,500.00 $113,600.00 Total Revenue Total COGS Total Gross Profit Part II. a. How can you determine the most profitable product mix scenario manually (without Excel or a caculator)? b. Discuss one of the major flaws in the underlying hidden assumption used in this scenario analysis Scroll down Write your answers below (I provide hints in the problem set for these two questions) A. I can figure out that ". scenario" is the most profitable scenario because Please complete the sentence ... B. The major flaw in the assumption used in the scenario analysis is that Please complete the sentence Part I. Analyzing the Product Pricing Mix with Scenario Manager and Part II. without any tools Part I. ==> Set up Scenario Manager in this worksheet and use the data provided in this worksheet via Data > What-lf Analysis > Scenario Manager Please perform the scenario analysis based on the data below in the gray area) and based on the pricing mixes assumption given in assignment 3 instruction! With Scenario Manager==> Manual Analysis ====> Max 2 1 Actual 0 0 Revenue Product A Product B Product C 2009 Target Unit Sold 3000 4500 2300 Unit Cost Unit Price $40.00 $50.00 $30.00 $45.00 $25.00 $32.00 2009 2009 Revenue Costs of Good Sold $150,000.00 $120,000.00 $202,500.00 $135,000.00 $73,600.00 $57,500.00 $426,100.00 $312,500.00 $113,600.00 Total Revenue Total COGS Total Gross Profit Part II. a. How can you determine the most profitable product mix scenario manually (without Excel or a caculator)? b. Discuss one of the major flaws in the underlying hidden assumption used in this scenario analysis Scroll down Write your answers below (I provide hints in the problem set for these two questions) A. I can figure out that ". scenario" is the most profitable scenario because Please complete the sentence ... B. The major flaw in the assumption used in the scenario analysis is that Please complete the sentenceStep by Step Solution
There are 3 Steps involved in it
Step: 1

Get Instant Access to Expert-Tailored Solutions
See step-by-step solutions with expert insights and AI powered tools for academic success
Step: 2

Step: 3

Ace Your Homework with AI
Get the answers you need in no time with our AI-driven, step-by-step assistance
Get Started


