Answered step by step
Verified Expert Solution
Link Copied!

Question

1 Approved Answer

a) Identify the two variables discussed in this table. /2 b) What age group is discussed in this table? /1 c) Identify how are values
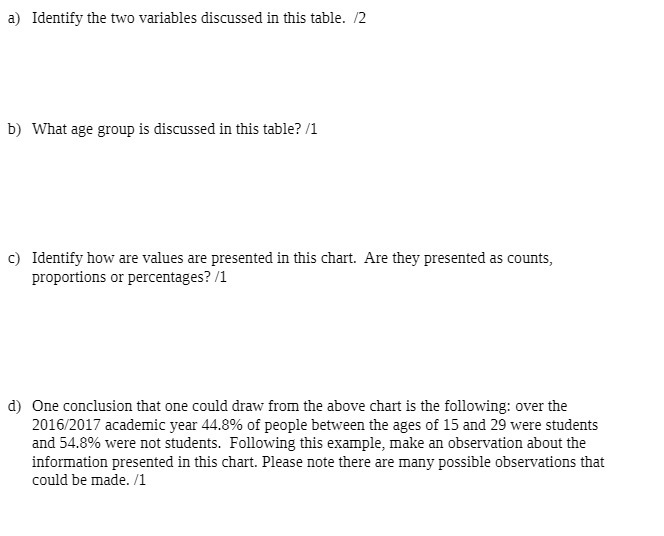
image text in transcribed
a) Identify the two variables discussed in this table. /2 b) What age group is discussed in this table? /1 c) Identify how are values are presented in this chart. Are they presented as counts, proportions or percentages? /1 d) One conclusion that one could draw from the above chart is the following: over the 2016/2017 academic year 44.8% of people between the ages of 15 and 29 were students and 54.8% were not students. Following this example, make an observation about the information presented in this chart. Please note there are many possible observations that could be made. /1

Step by Step Solution

There are 3 Steps involved in it

Step: 1

blur-text-image

Get Instant Access to Expert-Tailored Solutions

See step-by-step solutions with expert insights and AI powered tools for academic success

Step: 2

blur-text-image_2

Step: 3

blur-text-image_3

Ace Your Homework with AI

Get the answers you need in no time with our AI-driven, step-by-step assistance

Get Started

Recommended Textbook for

Intro Stats

Authors: Richard D. De Veaux, Paul F. Velleman, David E. Bock

3rd edition

321533283, 321533289, 9780321463708, 9780321503848, 9780321503800, 9780321499431, 9780321499417, 978-0321500458

More Books

Students also viewed these Mathematics questions