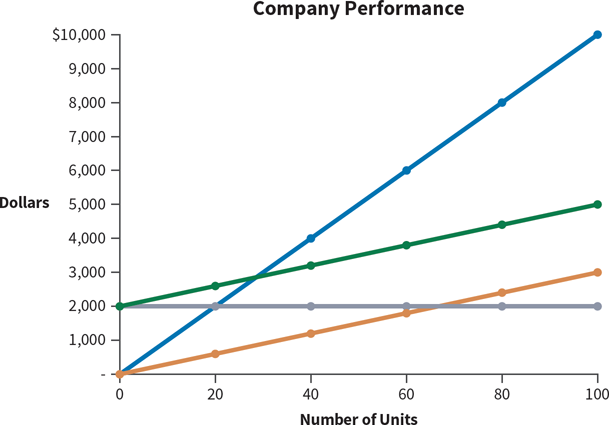
Question
a. Identify which line on the above graph represents the following (identify the line by color or describe its characteristics in words): Total costs. Fixed

a. Identify which line on the above graph represents the following (identify the line by color or describe its characteristics in words):
- Total costs.
- Fixed costs.
- Total revenues.
- Total variable costs.
b. Is the company making a profit when it sells 20 units? What about 40? 60?
c. If it sells 40 units, what are its total fixed costs? What is the fixed cost per unit at this level of sales?
d. If it sells 60 units, what are its total fixed costs? What is the fixed cost per unit at this level of sales?
e. It looks like the green and orange lines are parallel to each other. Explain whether they are or arent, and why.
f. How much income would the company generate if it sold 80 units? Also, what portion of the graph represents profit for the company?
g. If LaVonne had instead presented this companys performance in straightforward revenue and expense amounts, which income statement format could LaVonne use to quickly transform the above graphical information? Why?
h. Do you think it was helpful for LaVonne to utilize this visual presentation as opposed to the income statement format just mentioned in part (g)? Explain.
Company PerformanceStep by Step Solution
There are 3 Steps involved in it
Step: 1

Get Instant Access to Expert-Tailored Solutions
See step-by-step solutions with expert insights and AI powered tools for academic success
Step: 2

Step: 3

Ace Your Homework with AI
Get the answers you need in no time with our AI-driven, step-by-step assistance
Get Started


