Answered step by step
Verified Expert Solution
Question
1 Approved Answer
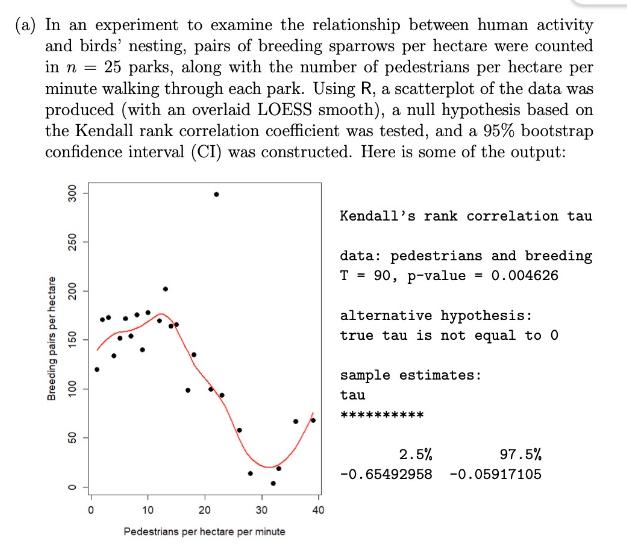
(a) In an experiment to examine the relationship between human activity and birds' nesting, pairs of breeding sparrows per hectare were counted in n


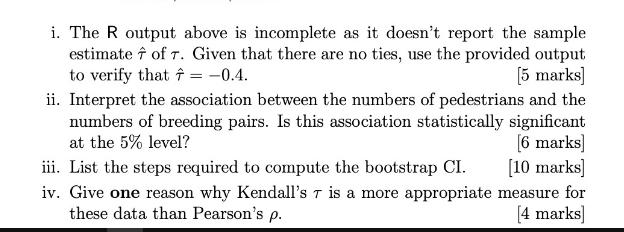
(a) In an experiment to examine the relationship between human activity and birds' nesting, pairs of breeding sparrows per hectare were counted in n = 25 parks, along with the number of pedestrians per hectare per minute walking through each park. Using R, a scatterplot of the data was produced (with an overlaid LOESS smooth), a null hypothesis based on the Kendall rank correlation coefficient was tested, and a 95% bootstrap confidence interval (CI) was constructed. Here is some of the output: 300 250 200 Breeding pairs per hectare 150 100 50 0 T 0 10 20 30 Pedestrians per hectare per minute 40 Kendall's rank correlation tau data: pedestrians and breeding T = 90, p-value = 0.004626 alternative hypothesis: true tau is not equal to 0 sample estimates: tau *** 2.5% -0.65492958 97.5% -0.05917105 i. The R output above is incomplete as it doesn't report the sample estimate of T. Given that there are no ties, use the provided output to verify that = -0.4. [5 marks] ii. Interpret the association between the numbers of pedestrians and the numbers of breeding pairs. Is this association statistically significant at the 5% level? [6 marks] [10 marks] measure for [4 marks] iii. List the steps required to compute the bootstrap CI. iv. Give one reason why Kendall's T is a more appropriate these data than Pearson's p. (b) State a nonparametric method that would be appropriate to use in each of the following two scenarios. Justify your choice with reference to at least one other appropriate or inappropriate parametric or nonparametric method in each case. A sample of 250 values was found to have a sample mean of 5 and a sample standard deviation of 3. It is of interest to test whether the data arose from a N ( = 5, o = 3) distribution. [4 marks] The pulse rate of 20 subjects was recorded before and after a period of intense exercise. A histogram of the differences in pulse rate before and after exercise (after minus before) indicated a heavily left-skewed distribution. It is of interest to formally test for a difference in median pulse rates. [4 marks]
Step by Step Solution
There are 3 Steps involved in it
Step: 1

Get Instant Access to Expert-Tailored Solutions
See step-by-step solutions with expert insights and AI powered tools for academic success
Step: 2

Step: 3

Ace Your Homework with AI
Get the answers you need in no time with our AI-driven, step-by-step assistance
Get Started


