Answered step by step
Verified Expert Solution
Question
1 Approved Answer
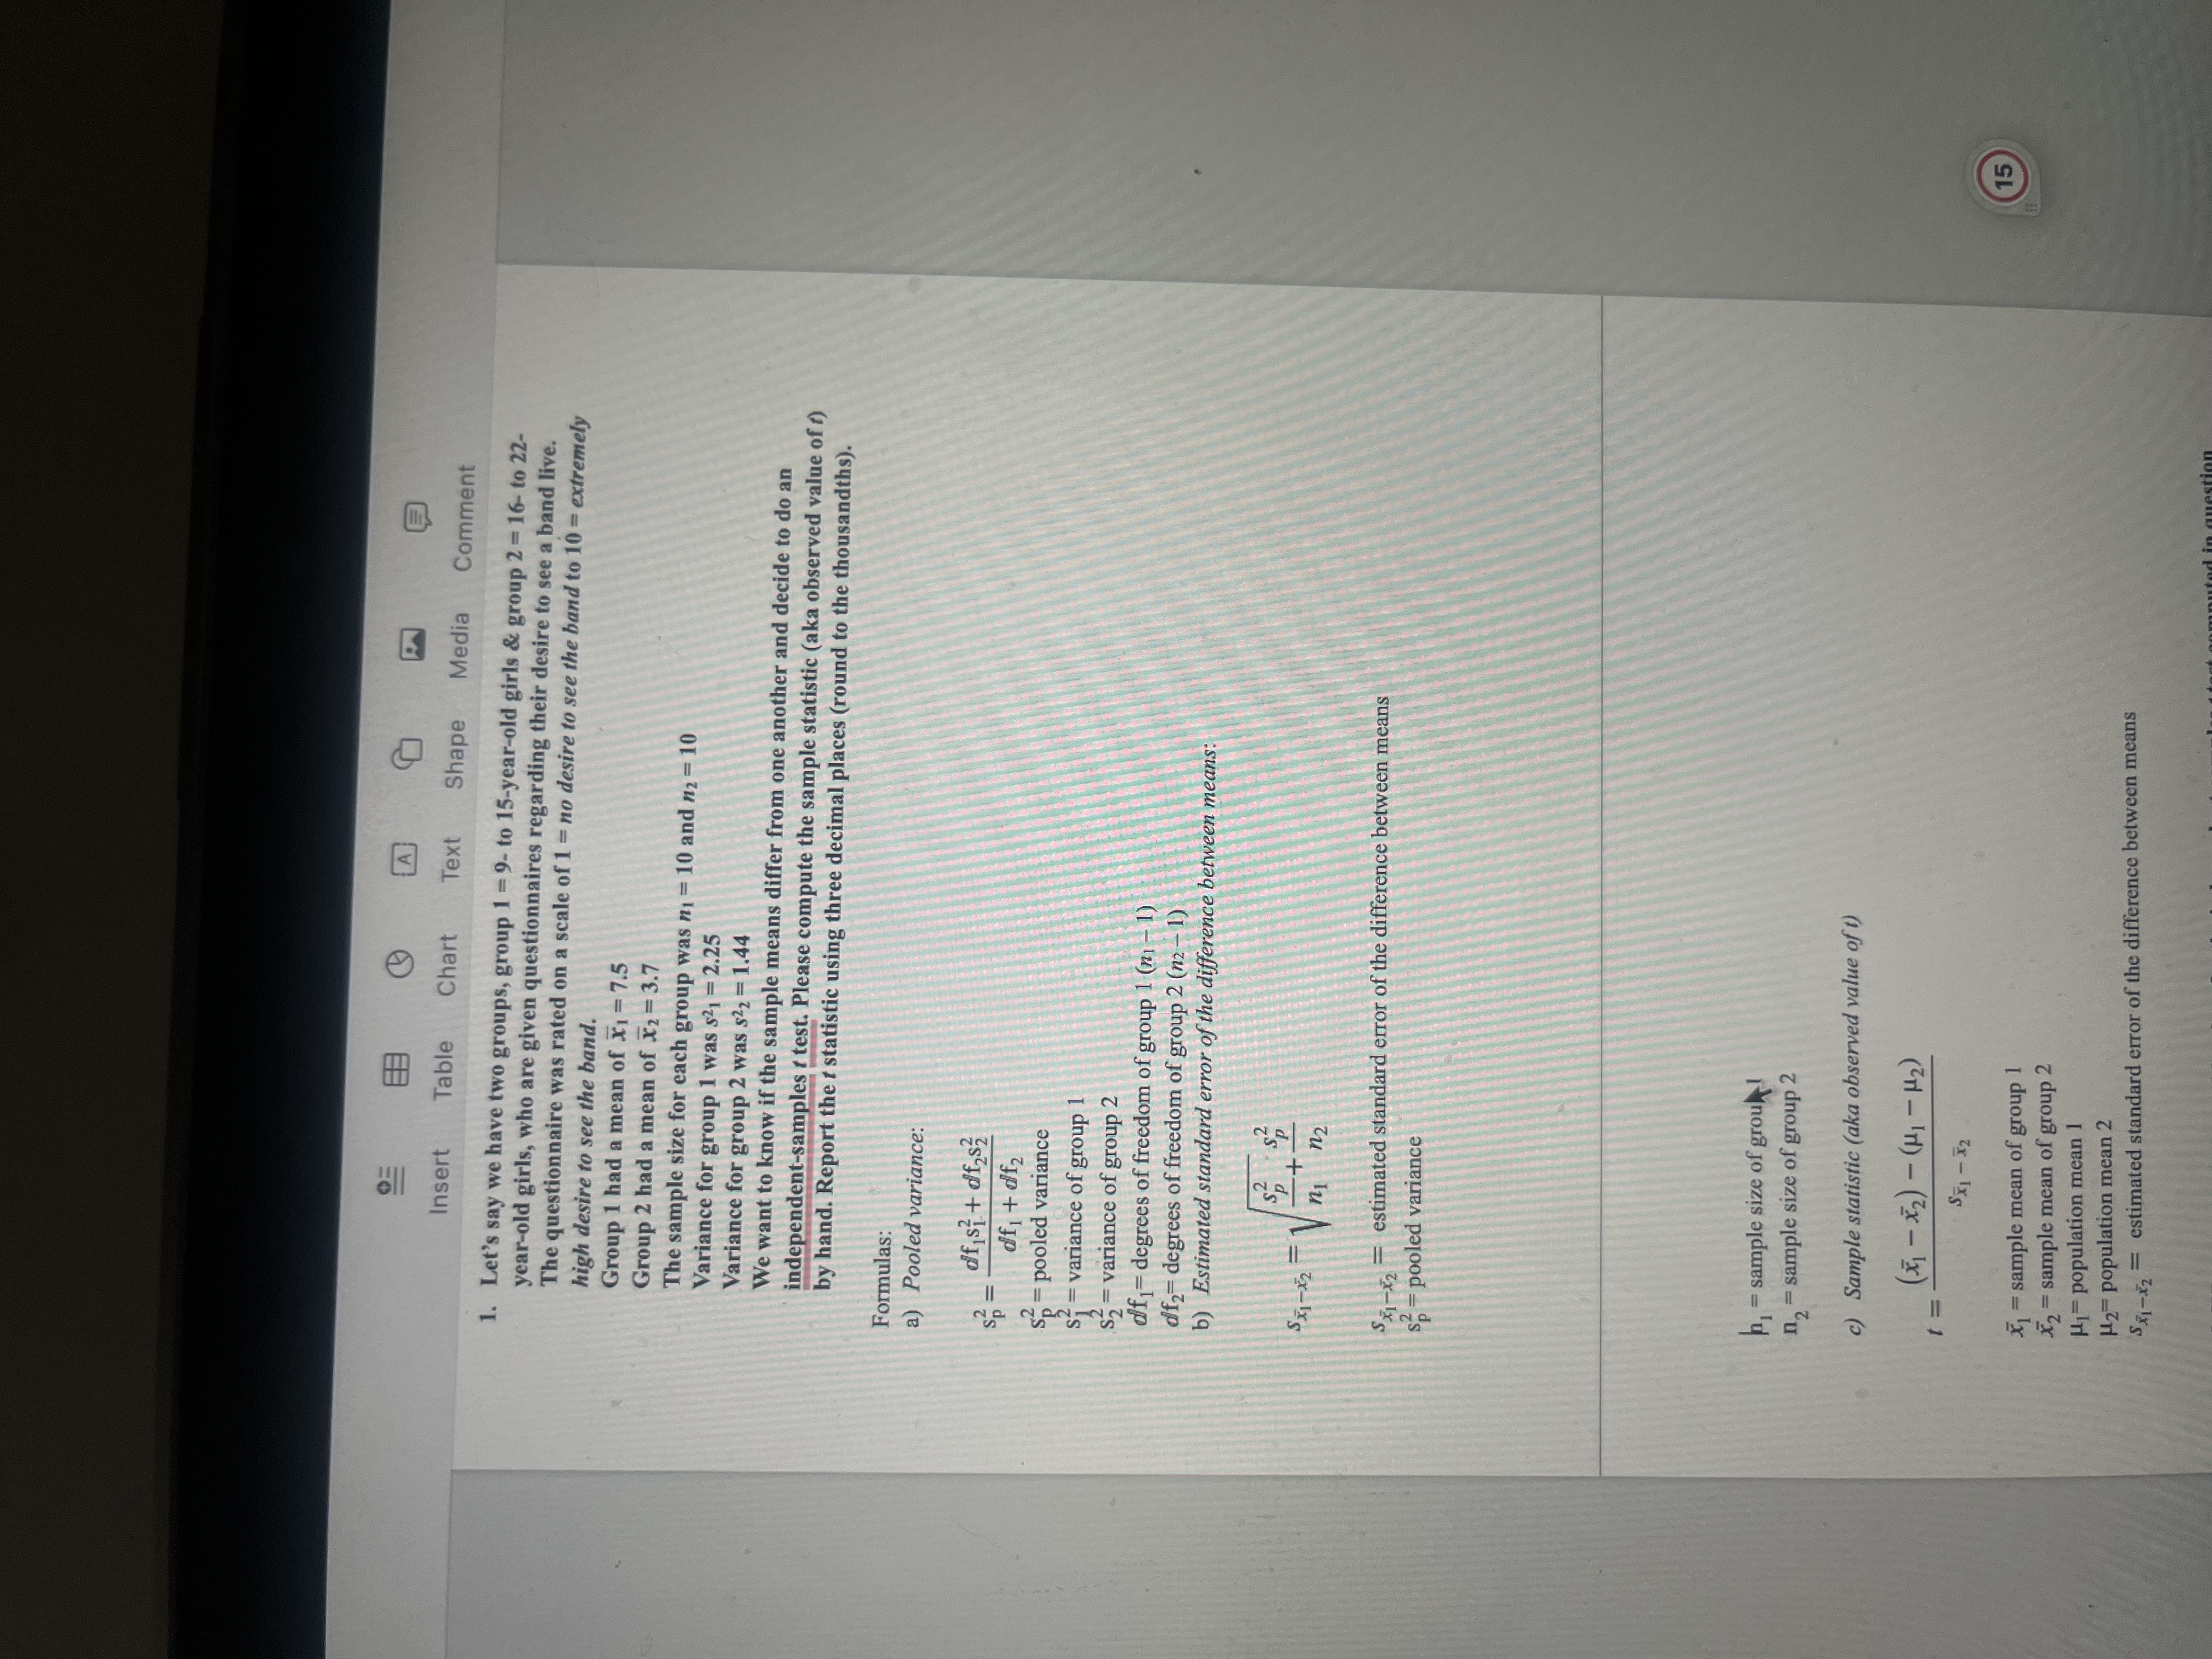
B A Insert Table Chart 1 Text Shape Media Comment 1. Let's say we have two groups, group 1 = 9- to 15-year-old girls


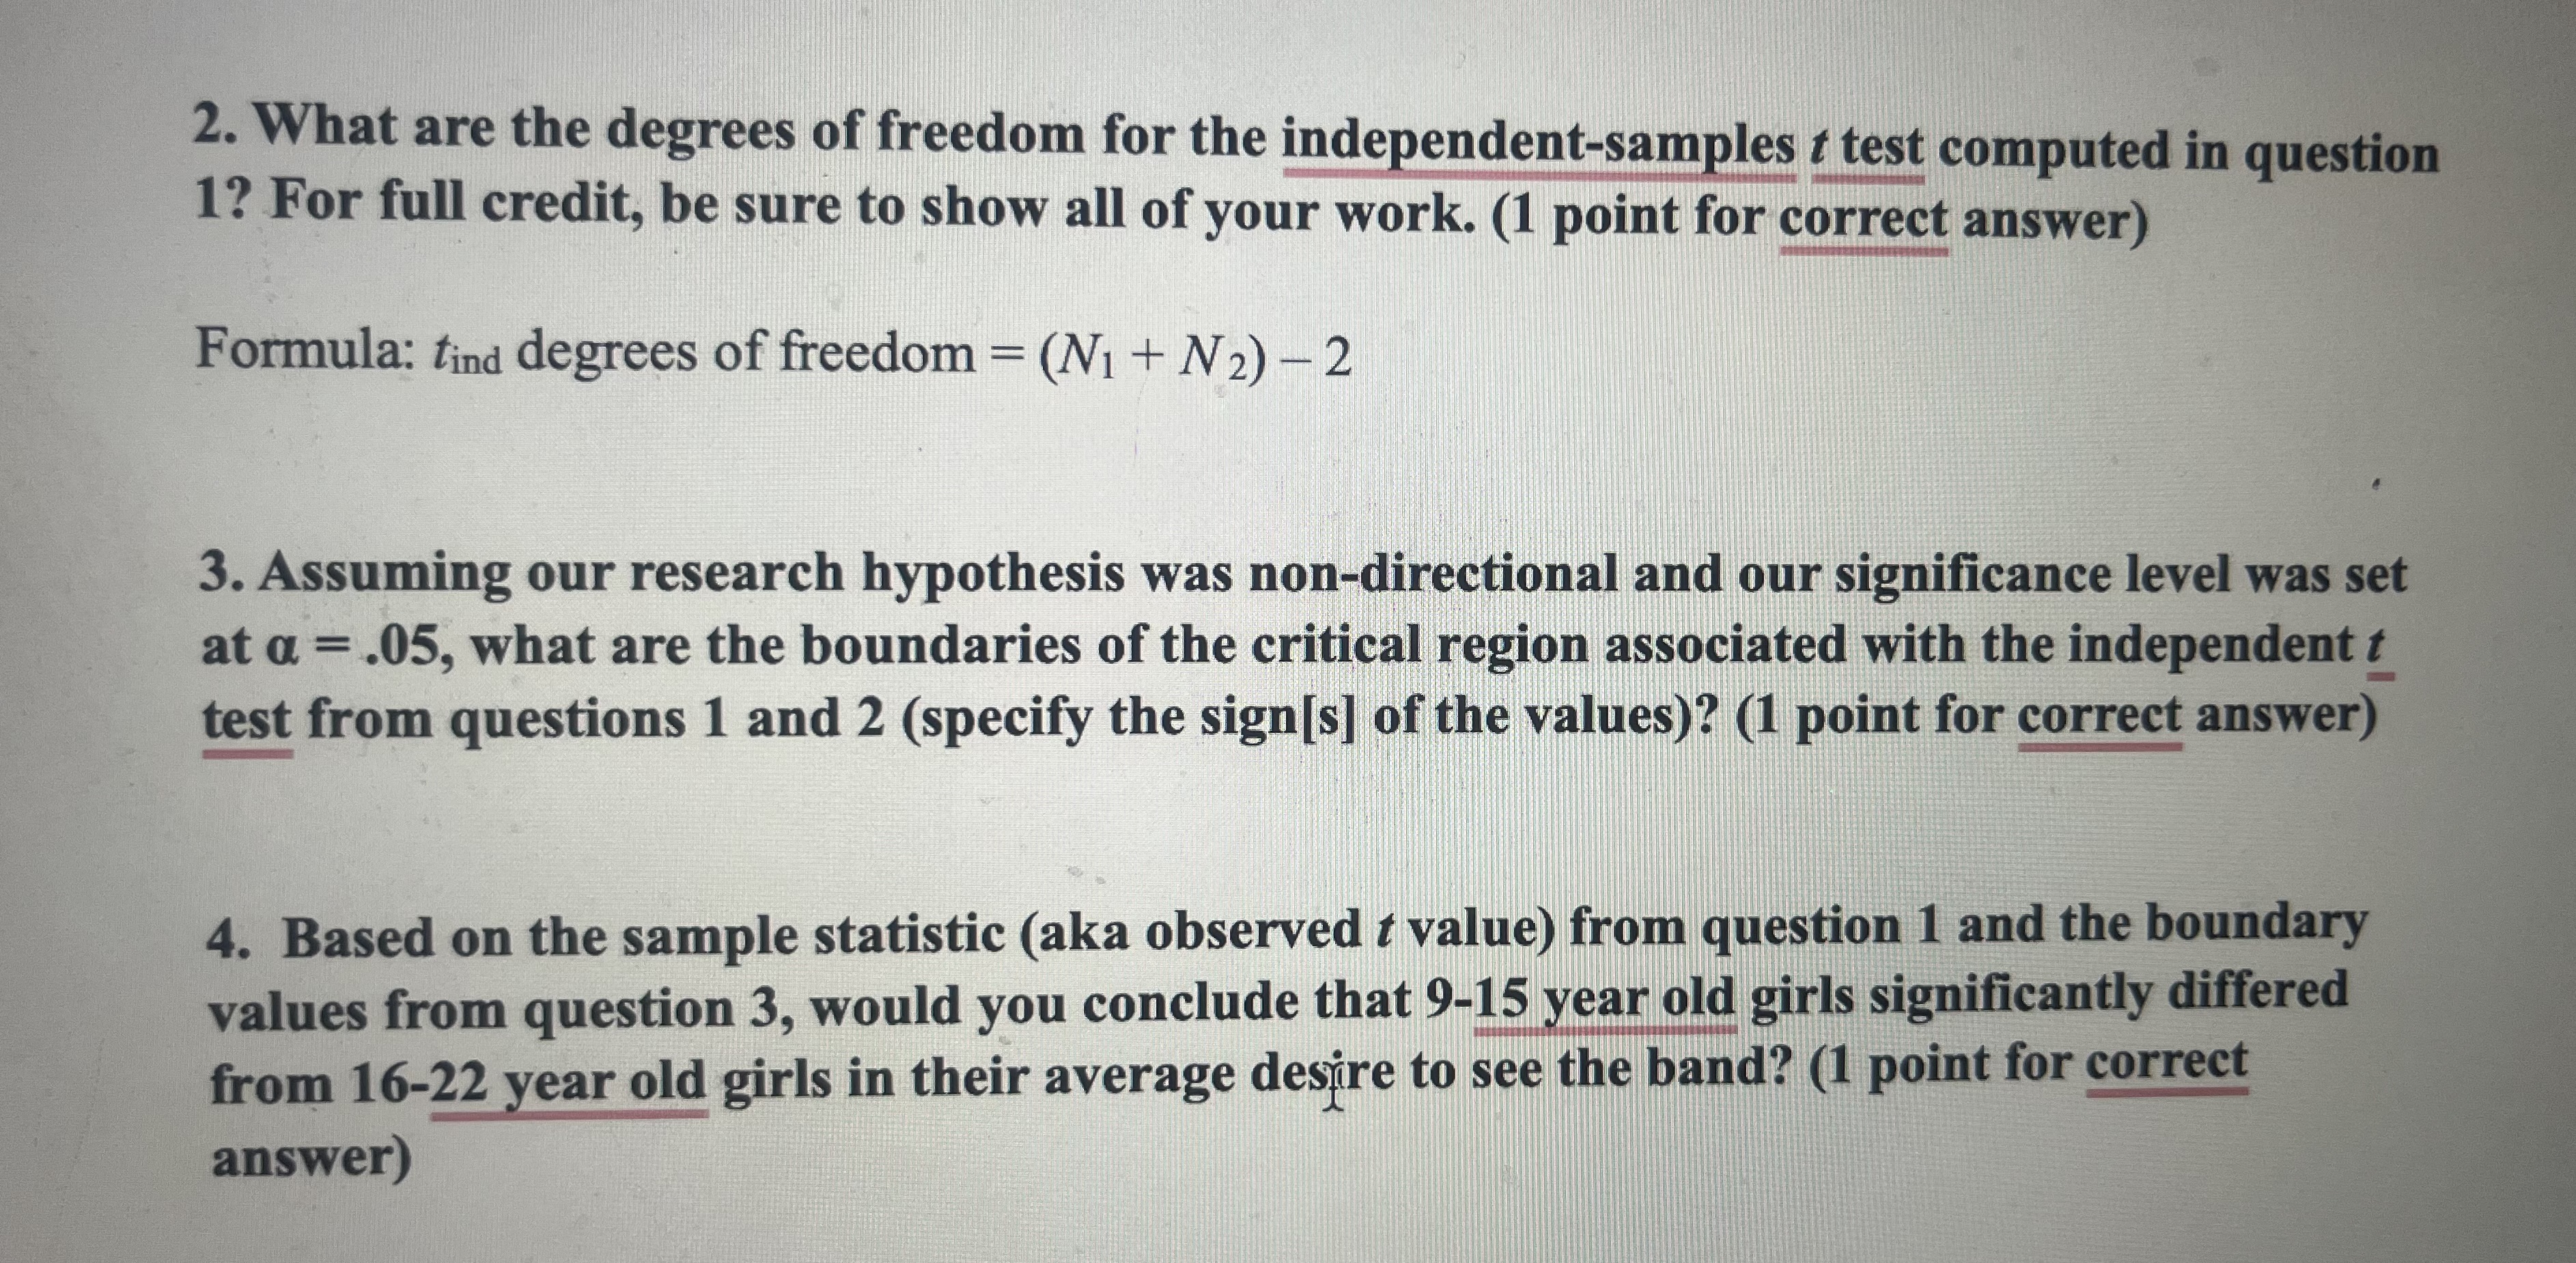
B A Insert Table Chart 1 Text Shape Media Comment 1. Let's say we have two groups, group 1 = 9- to 15-year-old girls & group 2 = 16- to 22- year-old girls, who are given questionnaires regarding their desire to see a band live. high desire to see the band. The questionnaire was rated on a scale of 1 = no desire to see the band to 10 = extremely Group 1 had a mean of = 7.5 Group 2 had a mean of x2 = 3.7 The sample size for each group was n = 10 and n = 10 Variance for group 1 was s = 2.25 Variance for group 2 was s22=1.44 We want to know if the sample means differ from one another and decide to do an independent-samples t test. Please compute the sample statistic (aka observed value of t) by hand. Report the t statistic using three decimal places (round to the thousandths). Formulas: a) Pooled variance: dfs+dfs = df +df = pooled variance S = variance of group 1 $2 = variance of group 2 df = degrees of freedom of group 1 (n - 1) df2= degrees of freedom of group 2 (n - 1) b) Estimated standard error of the difference between means: P Sxx n + 2 = estimated standard error of the difference between means s = pooled variance h = sample size of grou n2=sample size of group 2 c) Sample statistic (aka observed value of t) ()-(HI-H2) = sample mean of group 1 X2=sample mean of group 2 H population mean 1 H2 population mean 2 - = estimated standard error of the difference between means 15 2. What are the degrees of freedom for the independent-samples t test computed in question 1? For full credit, be sure to show all of your work. (1 point for correct answer) Formula: tind degrees of freedom = (N + N2)-2 3. Assuming our research hypothesis was non-directional and our significance level was set at a = .05, what are the boundaries of the critical region associated with the independent t test from questions 1 and 2 (specify the sign[s] of the values)? (1 point for correct answer) 4. Based on the sample statistic (aka observed t value) from question 1 and the boundary values from question 3, would you conclude that 9-15 year old girls significantly differed from 16-22 year old girls in their average desire to see the band? (1 point for correct answer)
Step by Step Solution
There are 3 Steps involved in it
Step: 1
To solve these questions well follow the steps for conducting an independentsamples ttest 1 Compute ...
Get Instant Access to Expert-Tailored Solutions
See step-by-step solutions with expert insights and AI powered tools for academic success
Step: 2

Step: 3

Ace Your Homework with AI
Get the answers you need in no time with our AI-driven, step-by-step assistance
Get Started


