

Answered step by step
Verified Expert Solution
Question
1 Approved Answer
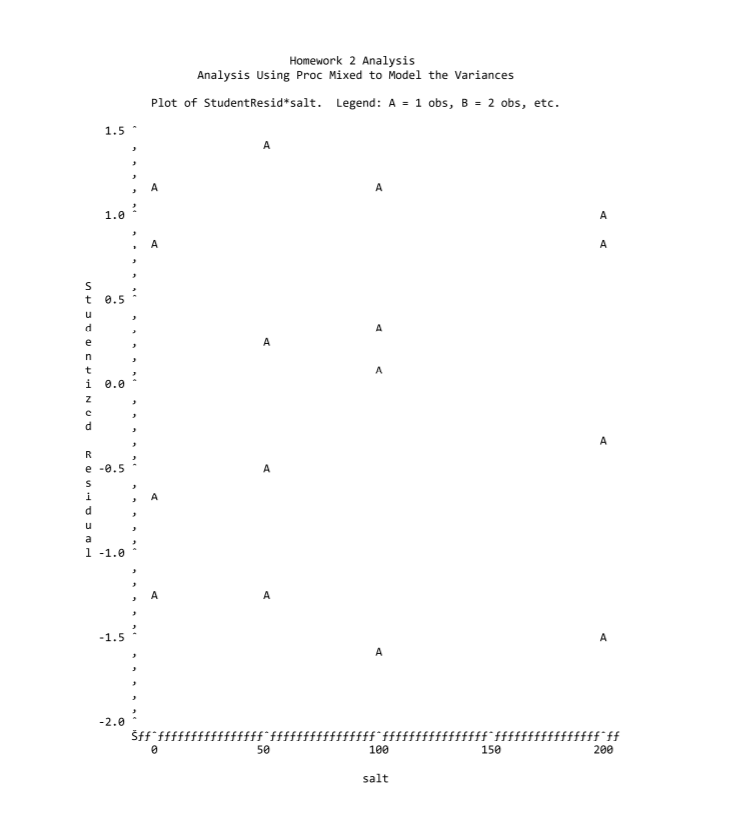
a.) Interpret the results shown in the graph of the residuals plotted against the treatment levels. Homework 2 Analysis Analysis Using Proc Mixed to Model
a.) Interpret the results shown in the graph of the residuals plotted against the treatment levels.
Step by Step Solution
There are 3 Steps involved in it
Step: 1

Get Instant Access to Expert-Tailored Solutions
See step-by-step solutions with expert insights and AI powered tools for academic success
Step: 2

Step: 3
Ace Your Homework with AI
Get the answers you need in no time with our AI-driven, step-by-step assistance
Get Started