A cable company claims that customers will wait in line is 20 minutes on average. A consumer advocate believes the average wait has increased.


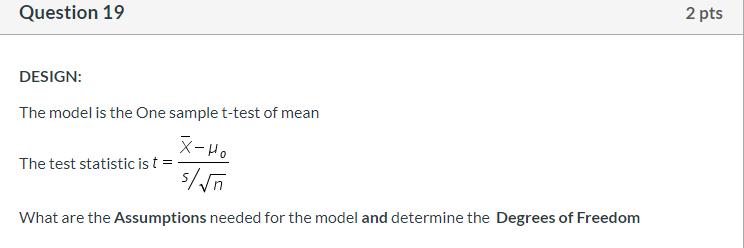
A cable company claims that customers will wait in line is 20 minutes on average. A consumer advocate believes the average wait has increased. 22 customers are sampled. Sample statistics for these 22 customers are: X=26_s=12 Can the consumer advocate support the claim that the mean wait in line is over 20 minutes? Test using a significance level of 1% Questions 17, 18, 19, 20 and 21 will all use this information Q17: DESIGN: Ha in context: The mean waiting time for customers at the cable company exceeds 20 minutes: State Ho and Ha in population parameters. Q18: DESIGN: State the Significance Level of the test and explain in context Type I error Question 19 DESIGN: The model is the One sample t-test of mean X-Ho s/n The test statistic is t = What are the Assumptions needed for the model and determine the Degrees of Freedom 2 pts Q20: DATA: The decision rule is to reject the null hypothesis if the p-value < a Compute the test statistic and determine the p-value. Do you reject or fail to reject Ho? make sure you show all work. Q21: CONCLUSION: State your overall conclusion in language that is clear, relates to the original problem and is consistent with your decision
Step by Step Solution
3.49 Rating (156 Votes )
There are 3 Steps involved in it
Step: 1
The information provided are as follows Population average 20 Sample mean x 26 Standard deviation s 12 Sample size n 22 Question 17 The null hypothesi...
See step-by-step solutions with expert insights and AI powered tools for academic success
Step: 2

Step: 3

Ace Your Homework with AI
Get the answers you need in no time with our AI-driven, step-by-step assistance
Get Started


