Question
A large corporation is interested in determining whether a relationship exists between the commuting time of its employees and the level of stress- related problems
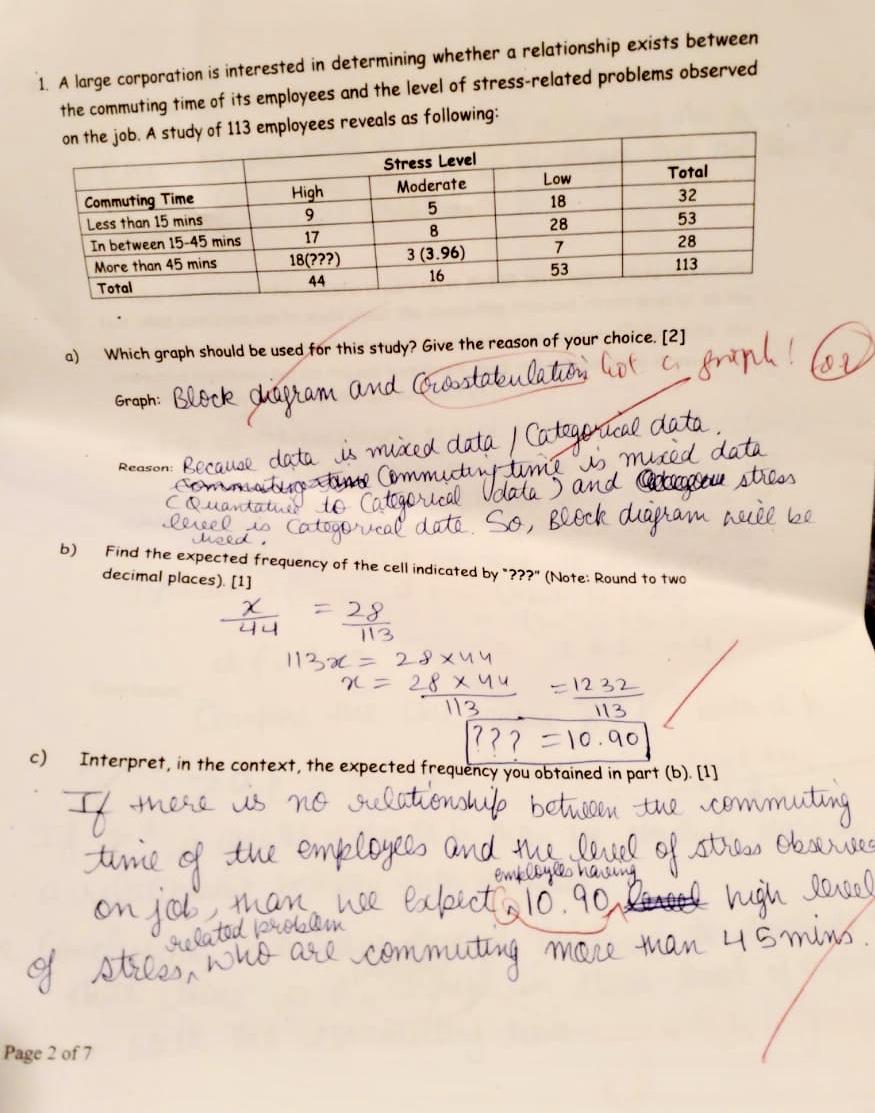
A large corporation is interested in determining whether a relationship exists between the commuting time of its employees and the level of stress- related problems observed on the job. A study of 113 employees reveals as following:
Stress Level
Commuting Time High Moderate Low Total
Less than 15 mins 9 5 18 32
In between 15-45 mins 17 8 28 53
More than 45 mins 18 (???) 3 (3.96) 7 28
Total 44 16 53 113
a) Which graph should be used for the study? Give the reason of your choice.
b) Find the expected frequency of the cell indicated by "???" ( Round to two decimal places)
3) Interpret in the context, the expected frequency you obtained in part (b)

Step by Step Solution
There are 3 Steps involved in it
Step: 1

Get Instant Access to Expert-Tailored Solutions
See step-by-step solutions with expert insights and AI powered tools for academic success
Step: 2

Step: 3

Ace Your Homework with AI
Get the answers you need in no time with our AI-driven, step-by-step assistance
Get Started


