Answered step by step
Verified Expert Solution
Question
1 Approved Answer
A liquid level control system is shown in the diagram below ( same as Figure 1 1 . 2 2 , page 1 8 6
A liquid level control system is shown in the diagram below same as Figure page of the Textbook:
Pigure exit line.
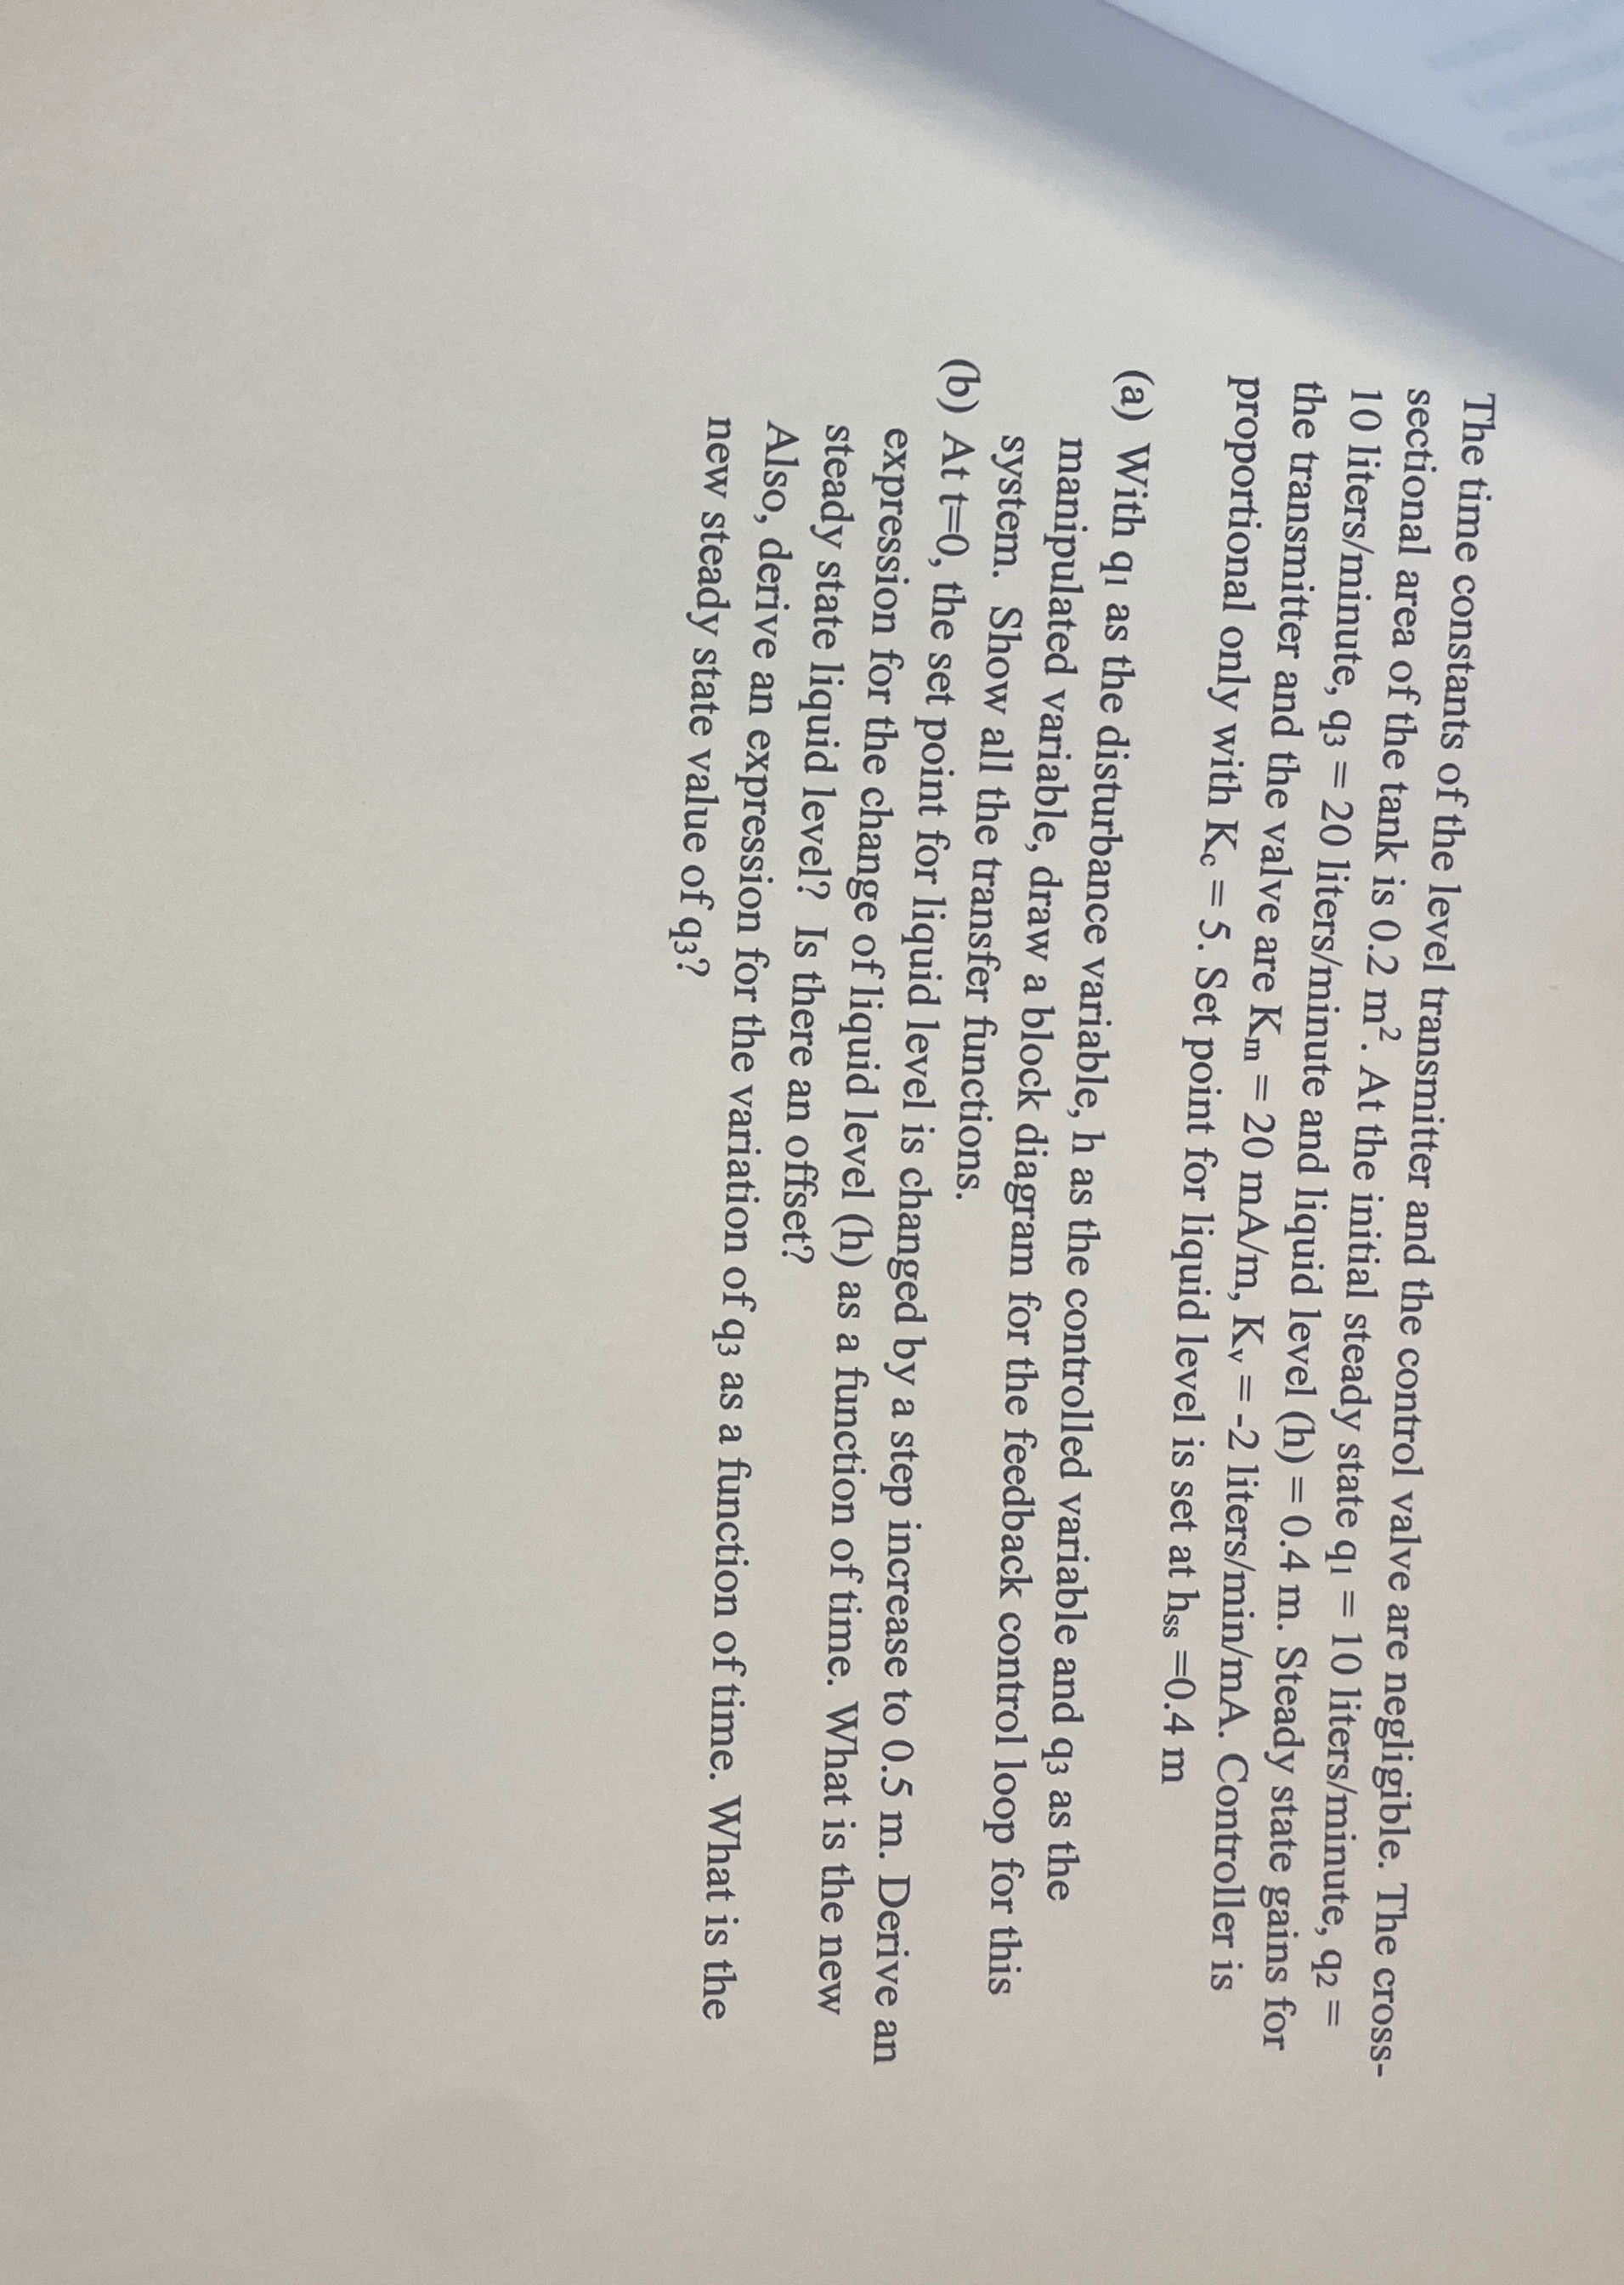
The time constants of the level transmitter and the control valve are negligible. The crosssectional area of the tank is At the initial steady state litersminute liters minute, liters minute and liquid level Steady state gains for the transmitter and the valve are liters Controller is proportional only with Set point for liquid level is set at
a With as the disturbance variable, as the controlled variable and as the manipulated variable, draw a block diagram for the feedback control loop for this system. Show all the transfer functions.
b At the set point for liquid level is changed by a step increase to Derive an expression for the change of liquid level as a function of time. What is the new steady state liquid level? Is there an offset?
Also, derive an expression for the variation of as a function of time. What is the new steady state value of

Step by Step Solution
There are 3 Steps involved in it
Step: 1

Get Instant Access to Expert-Tailored Solutions
See step-by-step solutions with expert insights and AI powered tools for academic success
Step: 2

Step: 3

Ace Your Homework with AI
Get the answers you need in no time with our AI-driven, step-by-step assistance
Get Started


