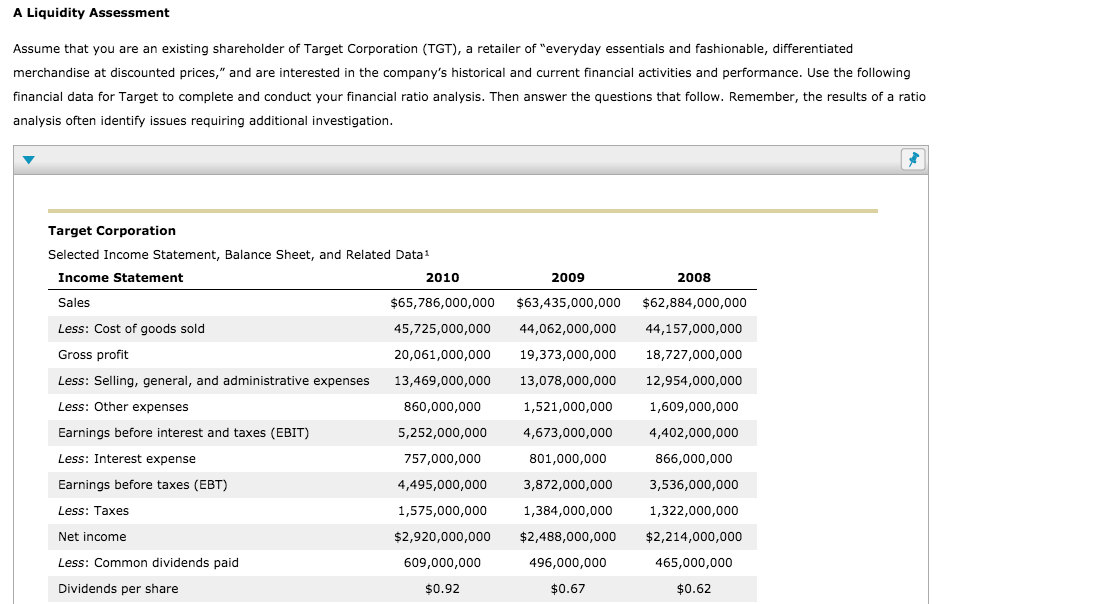
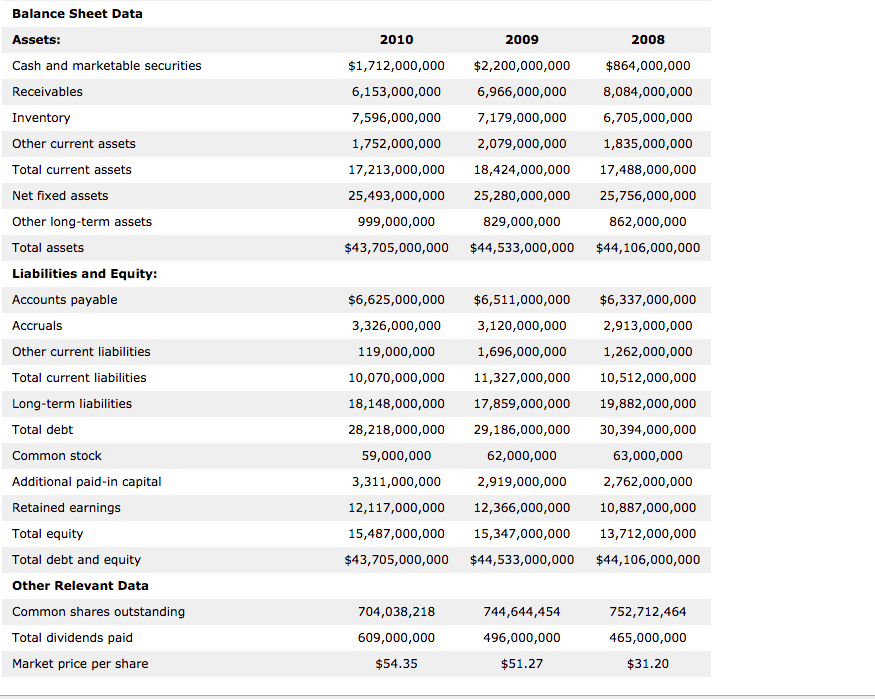
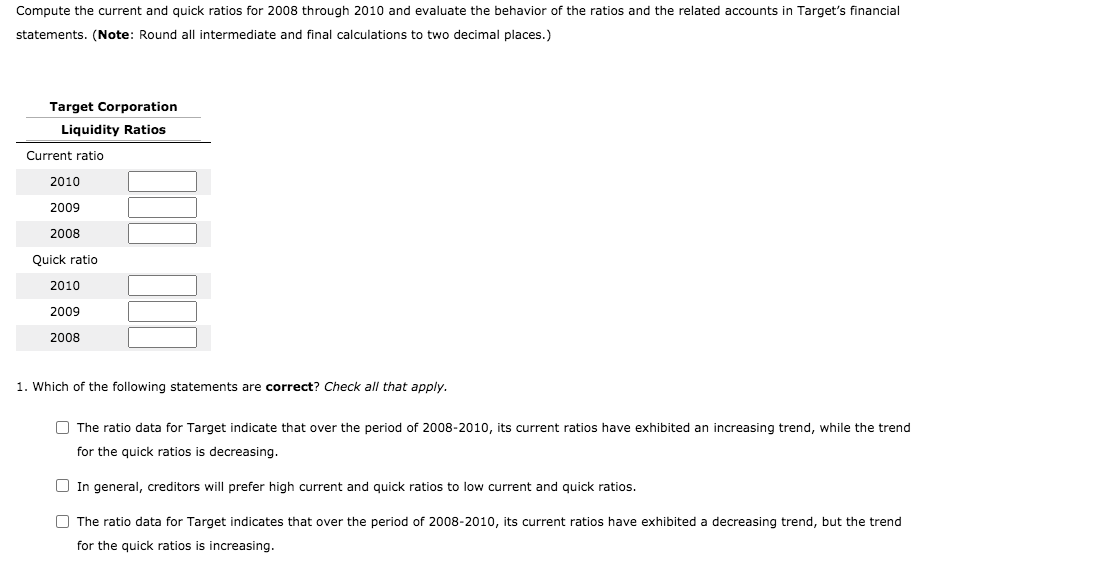
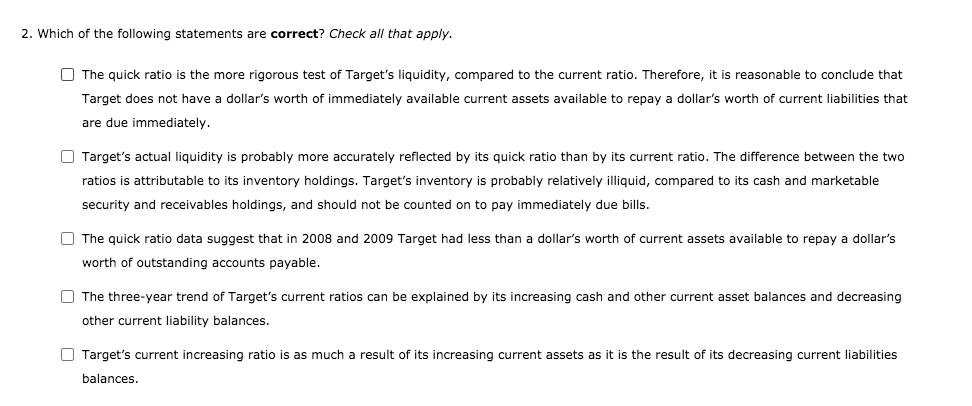
A Liquidity Assessment Assume that you are an existing shareholder of Target Corporation (TGT), a retailer of "everyday essentials and fashionable, differentiated merchandise at discounted prices," and are interested in the company's historical and current financial activities and performance. Use the following financial data for Target to complete and conduct your financial ratio analysis. Then answer the questions that follow. Remember, the results of a ratio analysis often identify issues requiring additional investigation. Target Corporation Selected Income Statement, Balance Sheet, and Related Data Income Statement 2010 2009 2008 Sales $65,786,000,000 $62,884,000,000 Less: Cost of goods sold 45,725,000,000 $63,435,000,000 44,062,000,000 19,373,000,000 44,157,000,000 Gross profit 20,061,000,000 18,727,000,000 Less: Selling, general, and administrative expenses 13,078,000,000 12,954,000,000 Less: Other expenses 13,469,000,000 860,000,000 5,252,000,000 1,521,000,000 4,673,000,000 1,609,000,000 4,402,000,000 Earnings before interest and taxes (EBIT) Less: Interest expense 757,000,000 801,000,000 866,000,000 Earnings before taxes (EBT) 4,495,000,000 3,872,000,000 3,536,000,000 Less: Taxes 1,575,000,000 1,384,000,000 1,322,000,000 $2,214,000,000 Net income $2,920,000,000 $2,488,000,000 Less: Common dividends paid 496,000,000 465,000,000 609,000,000 $0.92 Dividends per share $0.67 $0.62 2010 2009 2008 $1,712,000,000 6,153,000,000 7,596,000,000 1,752,000,000 17,213,000,000 25,493,000,000 999,000,000 $43,705,000,000 $2,200,000,000 6,966,000,000 7,179,000,000 2,079,000,000 18,424,000,000 25,280,000,000 829,000,000 $864,000,000 8,084,000,000 6,705,000,000 1,835,000,000 17,488,000,000 25,756,000,000 862,000,000 $44,106,000,000 $44,533,000,000 Balance Sheet Data Assets: Cash and marketable securities Receivables Inventory Other current assets Total current assets Net fixed assets Other long-term assets Total assets Liabilities and Equity: Accounts payable Accruals Other current liabilities Total current liabilities Long-term liabilities Total debt Common stock Additional paid-in capital Retained earnings Total equity Total debt and equity Other Relevant Data Common shares outstanding Total dividends paid Market price per share $6,511,000,000 3,120,000,000 1,696,000,000 $6,625,000,000 3,326,000,000 119,000,000 10,070,000,000 18,148,000,000 28,218,000,000 59,000,000 3,311,000,000 12,117,000,000 15,487,000,000 $43,705,000,000 11,327,000,000 17,859,000,000 29,186,000,000 62,000,000 2,919,000,000 12,366,000,000 $6,337,000,000 2,913,000,000 1,262,000,000 10,512,000,000 19,882,000,000 30,394,000,000 63,000,000 2,762,000,000 10,887,000,000 13,712,000,000 $44,106,000,000 15,347,000,000 $44,533,000,000 704,038,218 609,000,000 744,644,454 496,000,000 752,712,464 465,000,000 $31.20 $54.35 $51.27 Compute the current and quick ratios for 2008 through 2010 and evaluate the behavior of the ratios and the related accounts in Target's financial statements. (Note: Round all intermediate and final calculations to two decimal places.) Target Corporation Liquidity Ratios Current ratio 2010 2009 2008 Quick ratio 2010 2009 2008 1. Which of the following statements are correct? Check all that apply. The ratio data for Target indicate that over the period of 2008-2010, its current ratios have exhibited an increasing trend, while the trend for the quick ratios is decreasing. In general, creditors will prefer high current and quick ratios to low current and quick ratios. The ratio data for Target indicates that over the period of 2008-2010, its current ratios have exhibited a decreasing trend, but the trend for the quick ratios is increasing. 2. Which of the following statements are correct? Check all that apply. The quick ratio is the more rigorous test of Target's liquidity, compared to the current ratio. Therefore, it is reasonable to conclude that Target does not have a dollar's worth of immediately available current assets available to repay a dollar's worth of current liabilities that are due immediately. Target's actual liquidity is probably more accurately reflected by its quick ratio than by its current ratio. The difference between the two ratios is attributable to its inventory holdings. Target's inventory is probably relatively illiquid, compared to its cash and marketable security and receivables holdings, and should not be counted on to pay immediately due bills. The quick ratio data suggest that in 2008 and 2009 Target had less than a dollar's worth of current assets available to repay a dollar's worth of outstanding accounts payable. The three-year trend of Target's current ratios can be explained by its increasing cash and other current asset balances and decreasing other current liability balances. Target's current increasing ratio is as much a result of its increasing current assets as it is the result of its decreasing current liabilities balances