Question
A longitudinal project was conducted to study the executive and memory functions of elderly residents in a community. The participants were assessed every few years
A longitudinal project was conducted to study the executive and memory functions of elderly residents in a community. The participants were assessed every few years with a set of cognitive tests. Demographic and health information was also collected. The data set for Q1 and Q2 has been adapted from the data from that project. NOTE: Data prep may be required.
The researchers want to examine the participant demographic information collected from the first testing session. Run a two-tailed t-test with ? = .05 to answer the following research question:
Are the females and males significantly different in age ("Age")?
A. What type of t-test should be performed to answer this question? What is your rationale?
An independent sample t-test should be performed. There are two groups in the data on the dependent variable (continuous variable), which are grouped as a single variable. The rationale is that we are comparing the means of two independent groups (females and males) on a continuous variable (age).
(Notes from Lecture) -Between-subjects design ?Two groups of data on DV are organized as one variable, while adding a variable to indicate grouping
B. Create the null hypothesis from the research question. (Hint: Consider whether the hypotheses should be directional or non-directional for a two-tailed test.)
Null Hypothesis (H0): There is no significant difference in age between females and males at the first testing session.
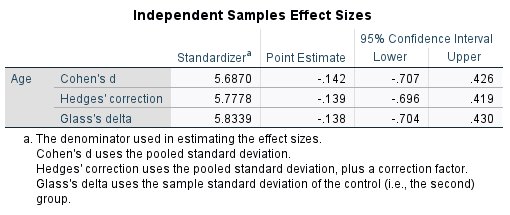
C. Run the analysis in SPSS and answer the following questions (C, D, E, and F) based on the analysis results. (Paste all the output tables from SPSS for this test)


Step by Step Solution
There are 3 Steps involved in it
Step: 1

Get Instant Access to Expert-Tailored Solutions
See step-by-step solutions with expert insights and AI powered tools for academic success
Step: 2

Step: 3

Ace Your Homework with AI
Get the answers you need in no time with our AI-driven, step-by-step assistance
Get Started


