Answered step by step
Verified Expert Solution
Question
1 Approved Answer
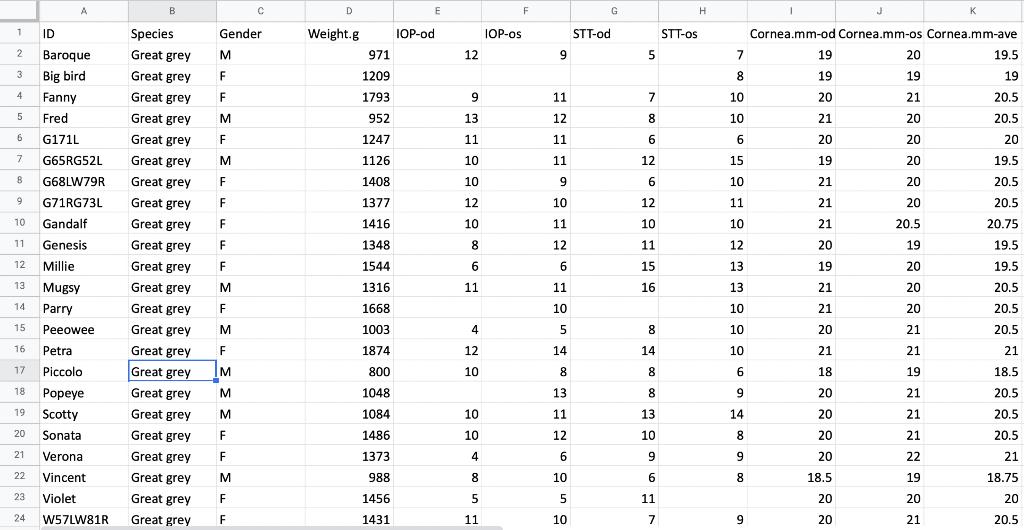
a) Make a scatterplot of the average corneal diameter on weight with both species on the same graph but with different symbols for each species.
a) Make a scatterplot of the average corneal diameter on weight with both species on the same graph but with different symbols for each species. Include a legend on your graph.
b) Obtain side-by-side boxplots for each of the variable's weight and average corneal diameter, grouped by species and then sex within species.
b) Obtain side-by-side boxplots for each of the variable's weight and average corneal diameter, grouped by species and then sex within species.


1 2 3 4 5 6 7 15 16 17 G65RG52L 8 G68LW79R 9 G71RG73L 18 19 10 Gandalf 11 Genesis Millie 12 13 14 20 21 22 A 23 ID Baroque Big bird 24 Fanny Fred G171L Mugsy Parry Peeowee Petra Piccolo Popeye Scotty Sonata Verona Vincent Violet W57LW81R B Species Great grey Great grey Great grey Great grey Great grey Great grey Great grey Great grey Great grey Great grey Great grey Great grey Great grey Great grey Great grey Great grey Great grey Great grey Great grey Great grey Great grey Great grey Great grey Gender M F F M F M F F F F F M F M F IM M M F C F M F F D Weight.g 971 1209 1793 952 1247 1126 1408 1377 1416 1348 1544 1316 1668 1003 1874 800 1048 1084 1486 1373 988 1456 1431 IOP-od E 12 9 13 11 10 10 12 10 8 6 11 4 12 10 194851 10 10 IOP-os F 9 11 12 11 11 9 10 11 12 6 11 10 5 14 8 13 11 12 6 10 5 10 G STT-od 5 7 8 6 12 6 12 10 11 15 16 8 14 8 8 13 10 9 6 11 7 STT-os H 7 8 10 10 6 15 10 11 10 12 13 13 10 10 10 6 9 14 8 9 8 9 1 J Cornea.mm-od Cornea.mm-os Cornea.mm-ave 19 19 20 21 20 19 21 21 21 20 19 21 21 20 21 18 20 20 20 20 18.5 20 20 20 19 21 20 20 20 20 20 20.5 19 20 20 20 21 21 19 21 21 21 22 19 20 21 19.5 19 20.5 20.5 20 19.5 20.5 20.5 20.75 19.5 19.5 20.5 20.5 20.5 21 18.5 20.5 20.5 20.5 21 18.75 20 20.5
Step by Step Solution
★★★★★
3.54 Rating (157 Votes )
There are 3 Steps involved in it
Step: 1

Get Instant Access to Expert-Tailored Solutions
See step-by-step solutions with expert insights and AI powered tools for academic success
Step: 2

Step: 3

Ace Your Homework with AI
Get the answers you need in no time with our AI-driven, step-by-step assistance
Get Started


