A market researcher collects a simple random sample of customers from a population of over a million customers that use a home improvement website. After
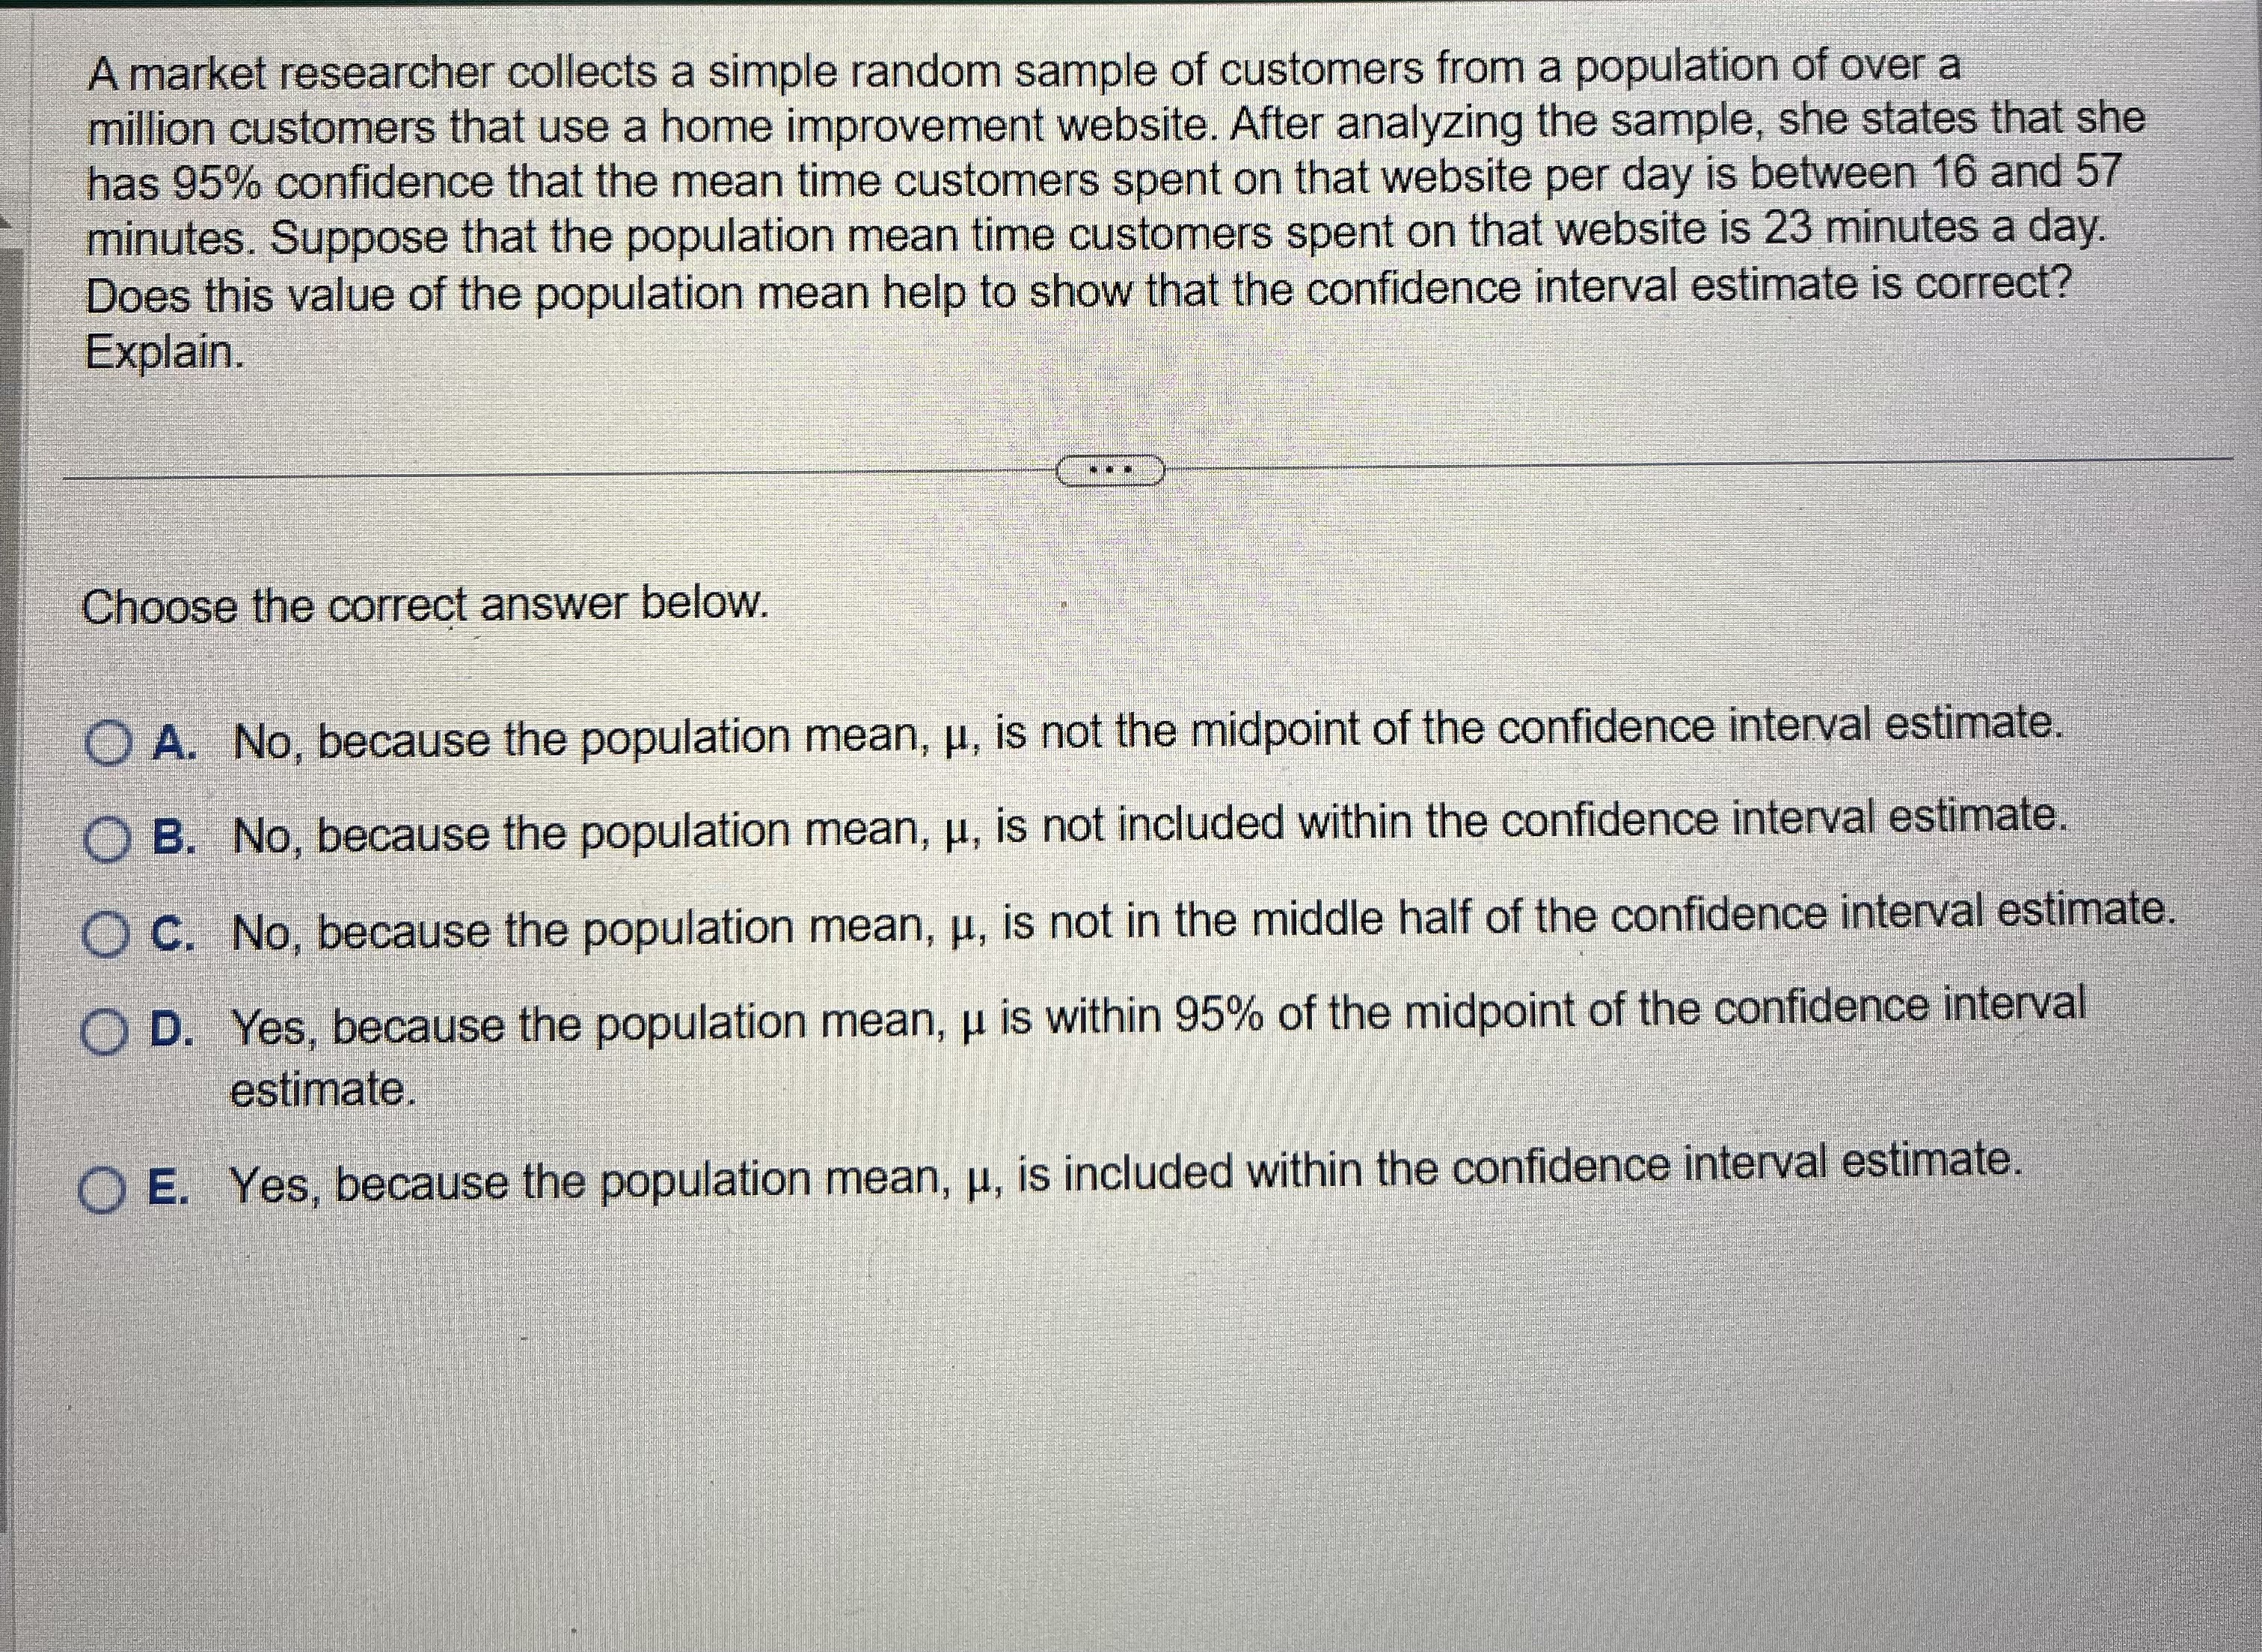
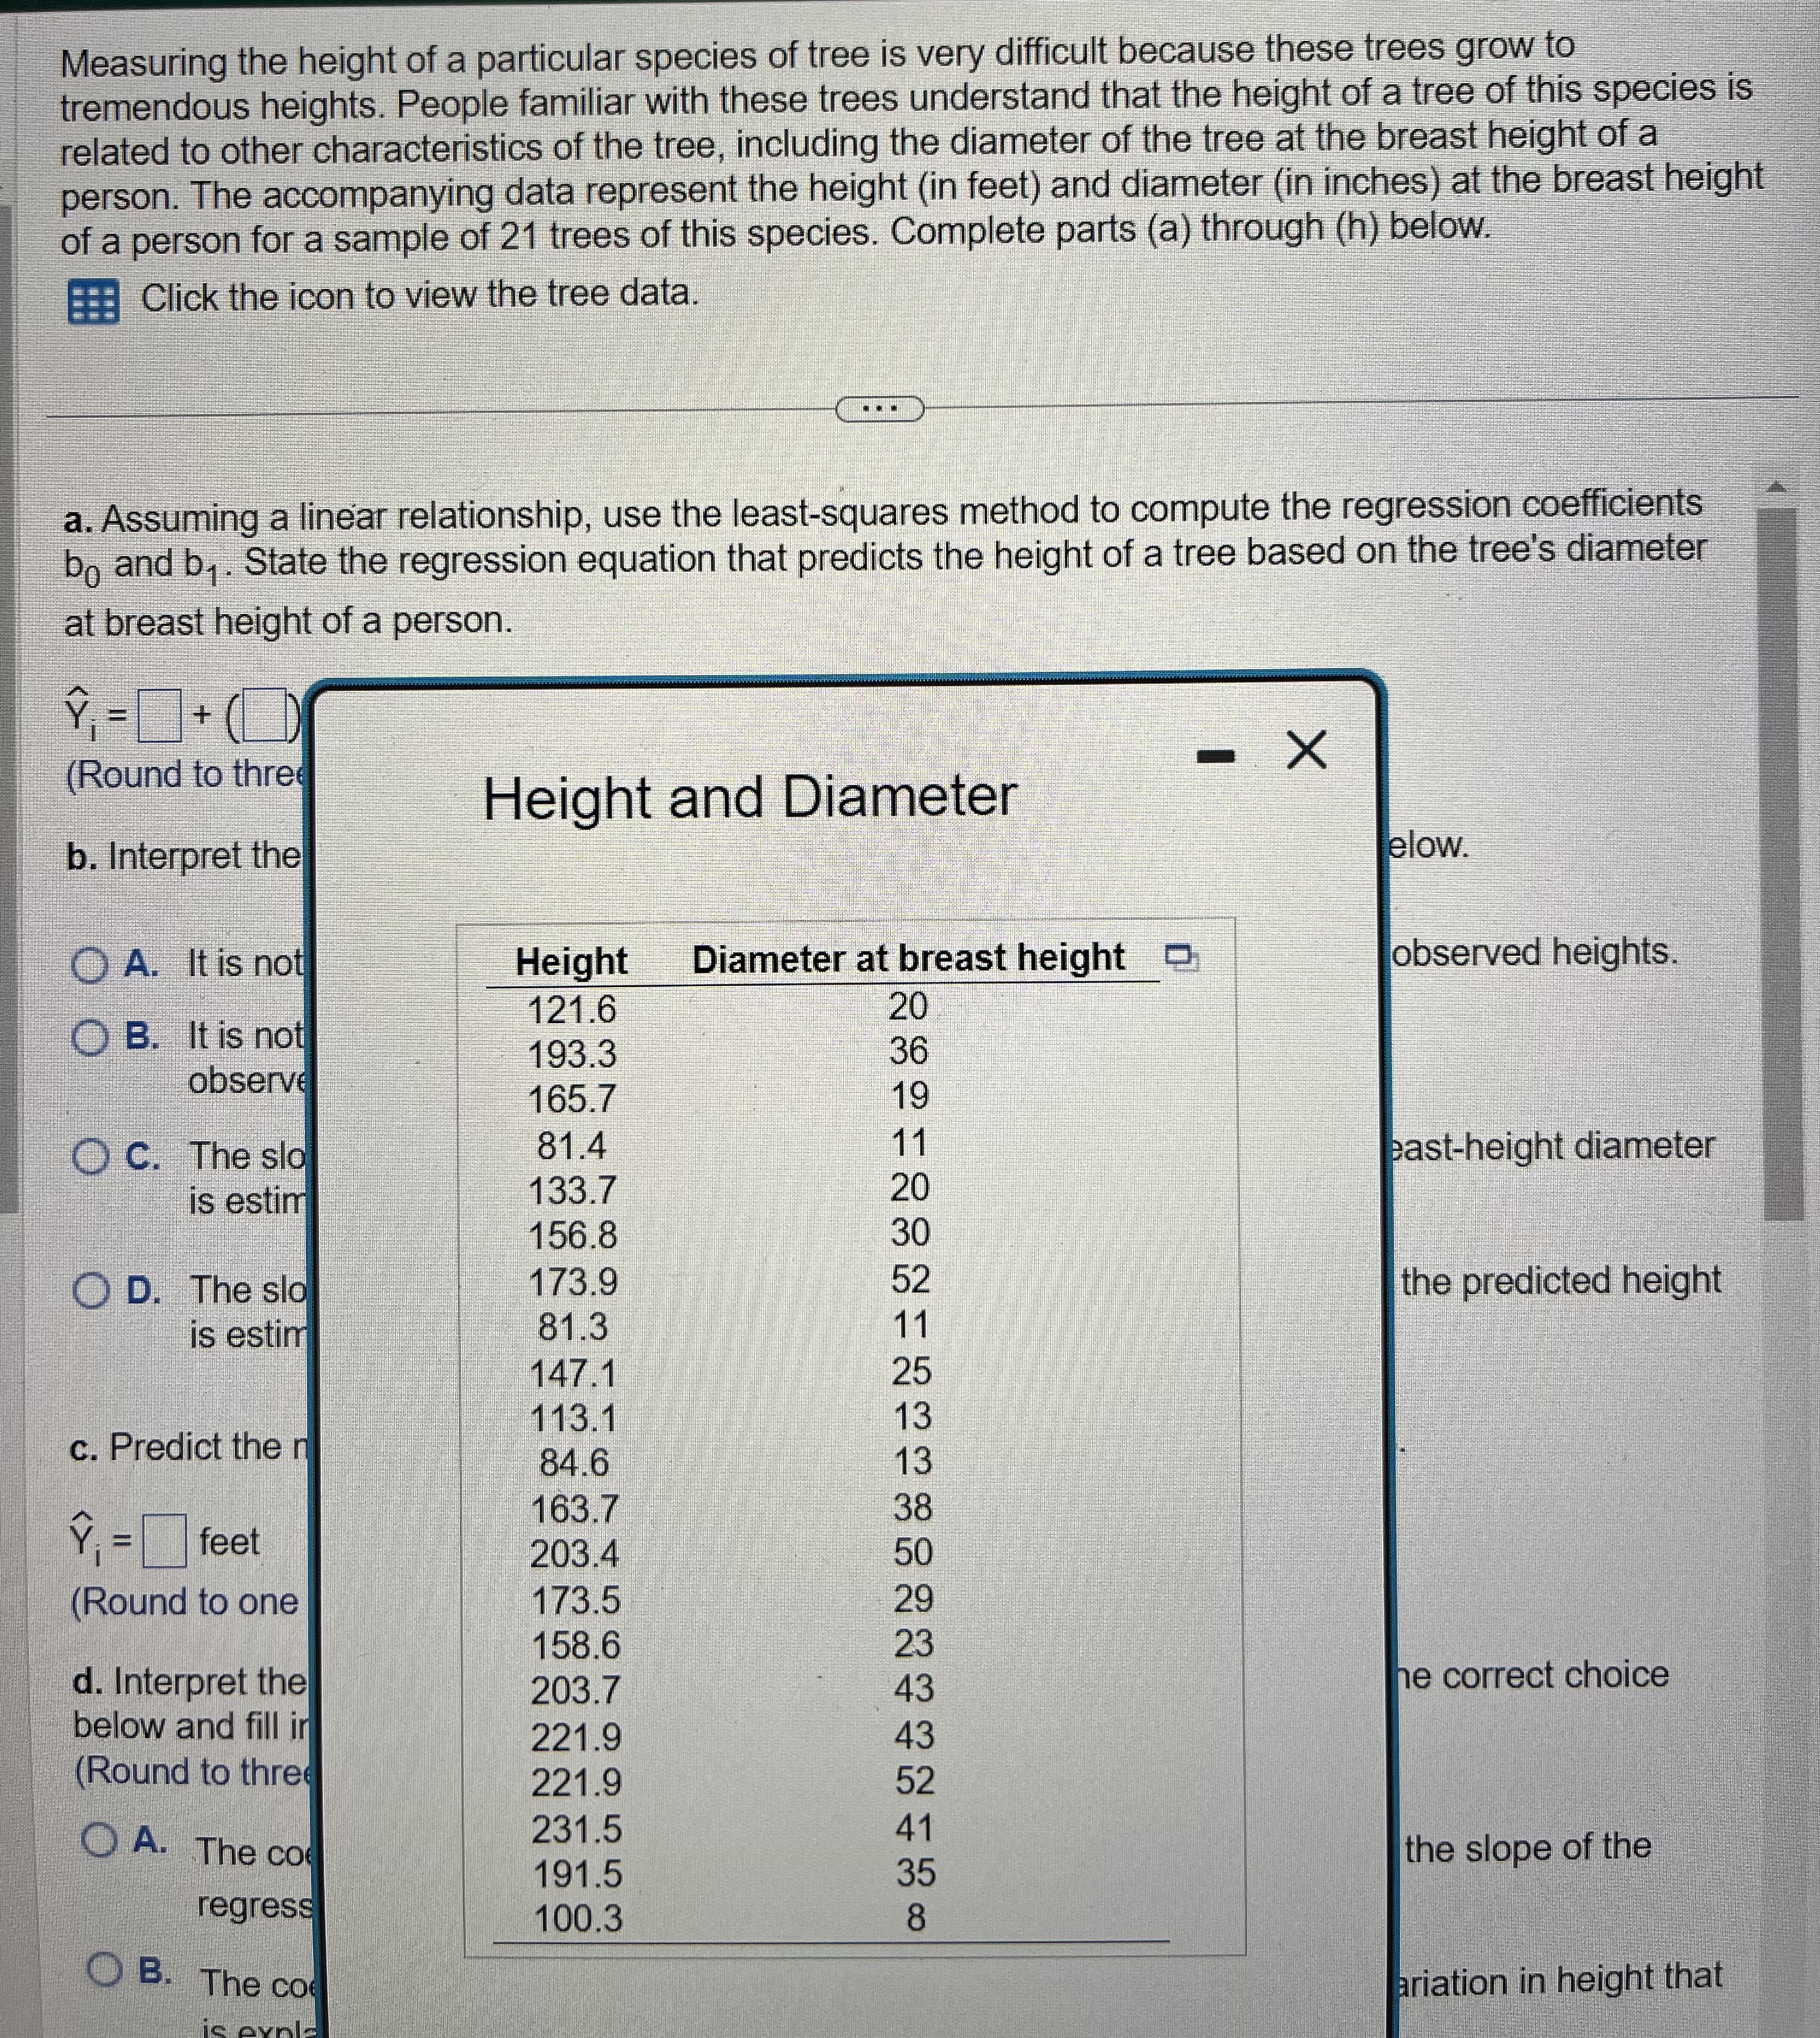
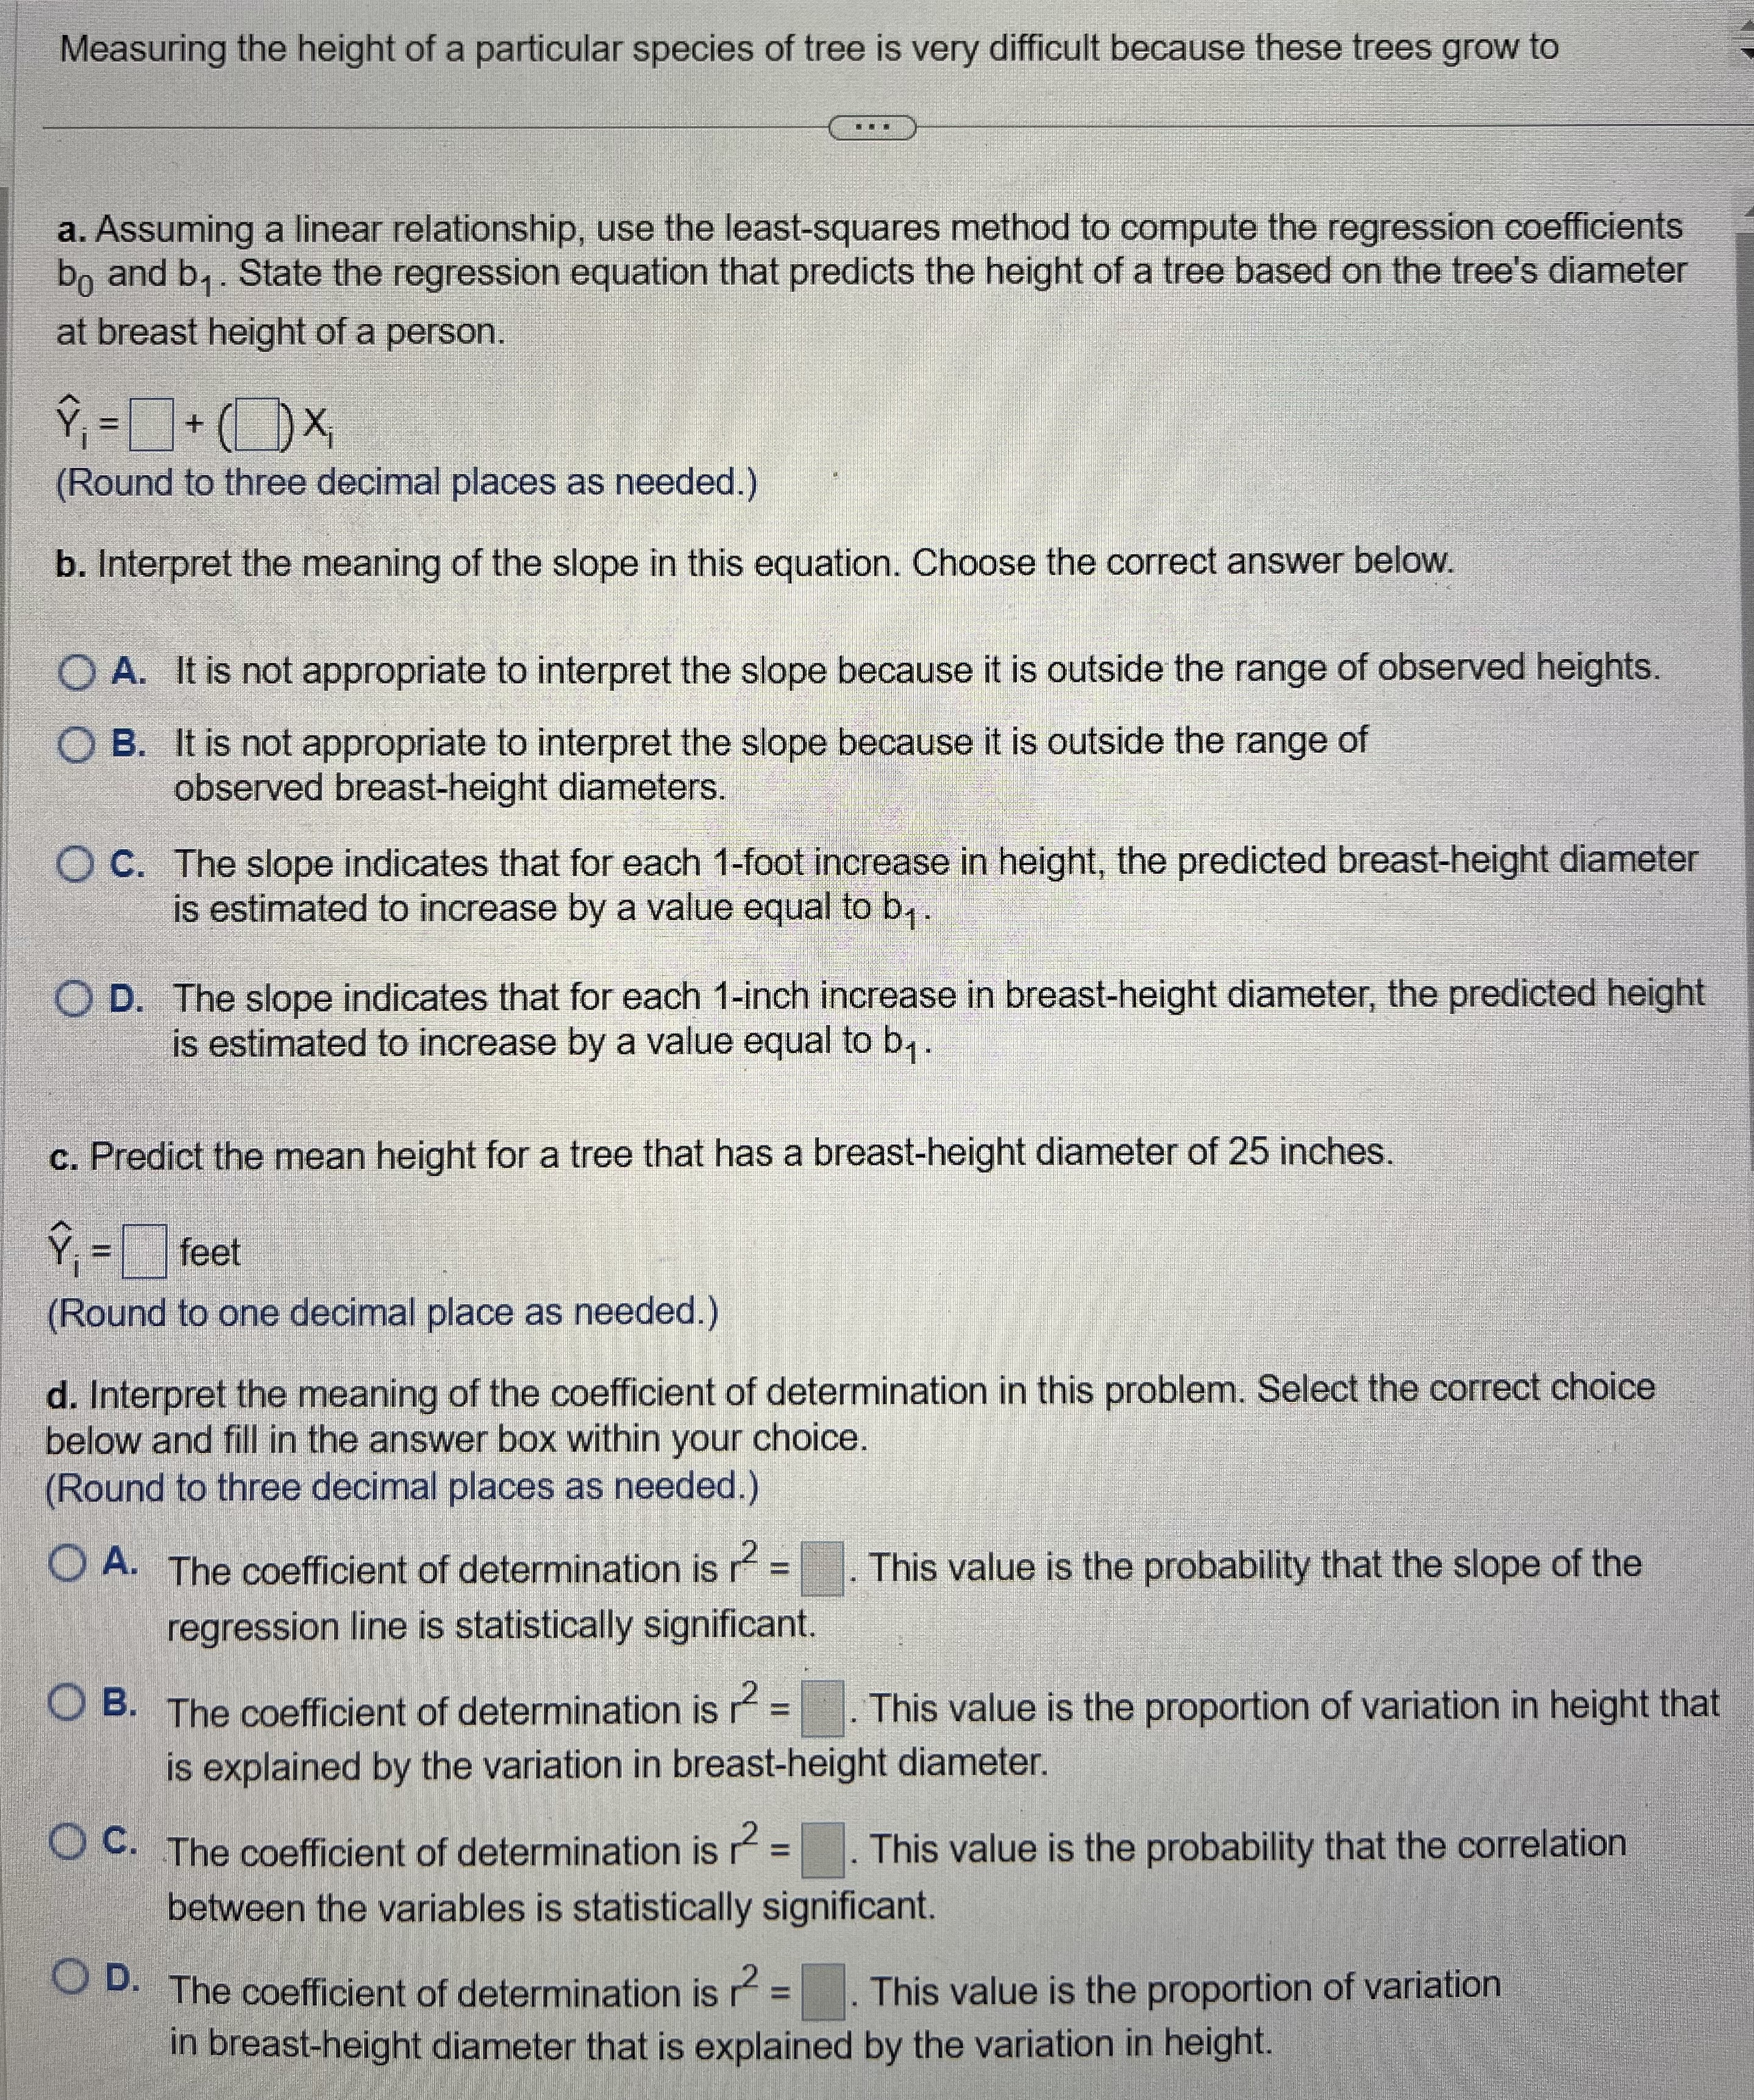
A market researcher collects a simple random sample of customers from a population of over a million customers that use a home improvement website. After analyzing the sample, she states that she has 95% confidence that the mean time customers spent on that website per day is between 16 and 57 minutes. Suppose that the population mean time customers spent on that website is 23 minutes a day. Does this value of the population mean help to show that the confidence interval estimate is correct? Explain. . . . Choose the correct answer below. O A. No, because the population mean, u, is not the midpoint of the confidence interval estimate. O B. No, because the population mean, u, is not included within the confidence interval estimate. O C. No, because the population mean, u, is not in the middle half of the confidence interval estimate. O D. Yes, because the population mean, u is within 95% of the midpoint of the confidence interval estimate. O E. Yes, because the population mean, u, is included within the confidence interval estimate.\fMeasuring the height of a particular species of tree is very difficult because these trees grow to a. Assuming a linear relationship, use the least-squares method to compute the regression coefficients bo and by . State the regression equation that predicts the height of a tree based on the tree's diameter at breast height of a person. (Round to three decimal places as needed.) b. Interpret the meaning of the slope in this equation. Choose the correct answer below. O A. It is not appropriate to interpret the slope because it is outside the range of observed heights. O B. It is not appropriate to interpret the slope because it is outside the range of observed breast-height diameters. O C. The slope indicates that for each 1-foot increase in height, the predicted breast-height diameter is estimated to increase by a value equal to by . D. The slope indicates that for each 1-inch increase in breast-height diameter, the predicted height is estimated to increase by a value equal to by . c. Predict the mean height for a tree that has a breast-height diameter of 25 inches. Y, = feet (Round to one decimal place as needed.) d. Interpret the meaning of the coefficient of determination in this problem. Select the correct choice below and fill in the answer box within your choice. (Round to three decimal places as needed.) A. The coefficient of determination is r = . This value is the probability that the slope of the regression line is statistically significant. B. The coefficient of determination is r = . This value is the proportion of variation in height that is explained by the variation in breast-height diameter. C. The coefficient of determination is = . This value is the probability that the correlation between the variables is statistically significant. D. The coefficient of determination is r = . This value is the proportion of variation in breast-height diameter that is explained by the variation in height.\fTwenty-nine volunteers are recruited to participate in an experiment. A measurement is made (such as blood pressure) before each volunteer is asked to read a particularly upsetting passage from a book and after each volunteer reads the passage from the book. In the analysis of the data collected from this experiment, how many degrees of freedom are there in the test? There are degrees of freedom. Simplify your answer.)
Step by Step Solution
There are 3 Steps involved in it
Step: 1
Get Instant Access to Expert-Tailored Solutions
See step-by-step solutions with expert insights and AI powered tools for academic success
Step: 2
Step: 3
Ace Your Homework with AI
Get the answers you need in no time with our AI-driven, step-by-step assistance