Answered step by step
Verified Expert Solution
Link Copied!

Question

1 Approved Answer

A marketing study of 800 adults in the 18-34 age group reported the following information: * Spent less than $100 on children's clothing per year:
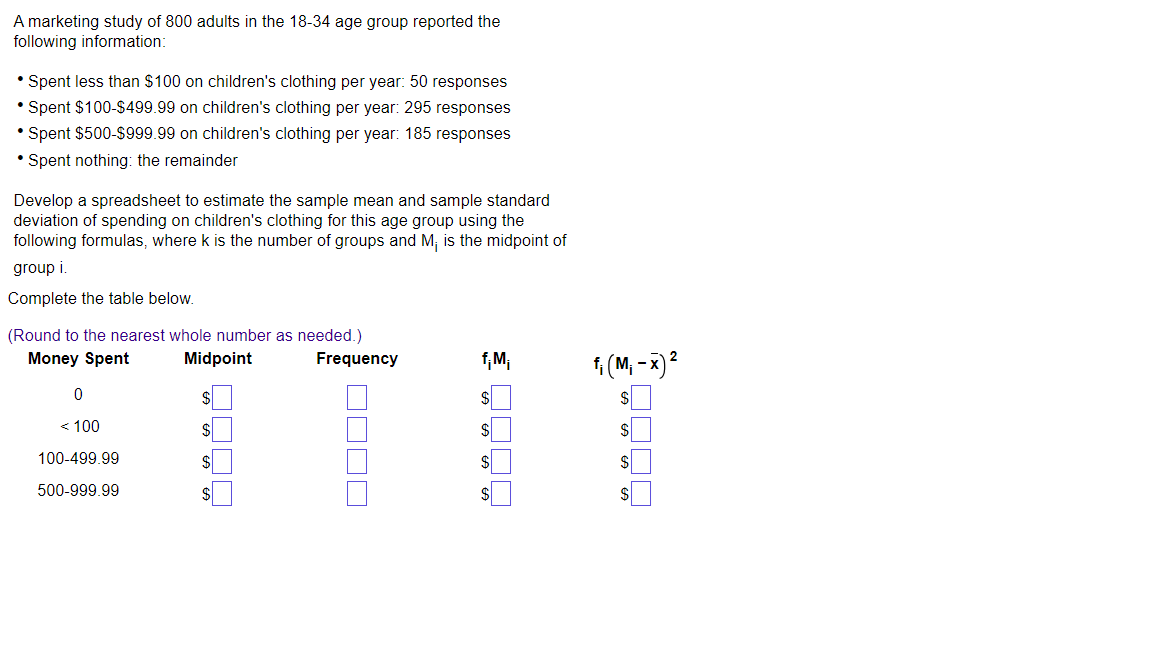
image text in transcribed
A marketing study of 800 adults in the 18-34 age group reported the following information: * Spent less than $100 on children's clothing per year: 50 responses * Spent $100-5499 99 on children's clothing per year: 295 responses * Spent $500-5999.99 on children's clothing per year: 185 responses * Spent nothing: the remainder Develop a spreadsheet to estimate the sample mean and sample standard deviation of spending on children's clething for this age group using the following formulas, where k is the number of groups and M, is the midpoint of group i. Complete the table below. {Round to the nearest whole number as needed.) Money Spent Midpoint Frequency f;M; f; (Mi - x) 2 0 $ $ $ =100 g g 3 100-499.99 $ 3 g 500-999.99 $ 3 g

Step by Step Solution

There are 3 Steps involved in it

Step: 1

blur-text-image

Get Instant Access to Expert-Tailored Solutions

See step-by-step solutions with expert insights and AI powered tools for academic success

Step: 2

blur-text-image

Step: 3

blur-text-image

Ace Your Homework with AI

Get the answers you need in no time with our AI-driven, step-by-step assistance

Get Started

Recommended Textbook for

Numerical Analysis

Authors: Richard L. Burden, J. Douglas Faires

9th edition

538733519, 978-1133169338, 1133169333, 978-0538733519

More Books

Students also viewed these Mathematics questions

Question

4. What is the role of the summation function?

Answered: 1 week ago

Question

1. Signs and symbols of the map Briefly by box ?

Answered: 1 week ago

Question

Types of physical Maps?

Answered: 1 week ago

Question

Explain Intermediate term financing in detail.

Answered: 1 week ago