

Question
A money demand function is defined as follows: Where M1 is the narrow money supply, GDP is real GDP, RS is the interest rate and
A money demand function is defined as follows:
Where M1 is the narrow money supply, GDP is real GDP, RS is the interest rate and PR is the rate of inflation
The model was estimated using quarterly data for the United States over the period
1952:1-1992:4 (T=163 observations) and using two different specifications: Specification 1
assumes the model suers autocorrelation AR(1) and Specification 2 assumes the structure
in the error terms following AR(2) process. The following table shows estimation results:
Note that the dependent variable in Model 1 is log(M1) and the dependent variable in
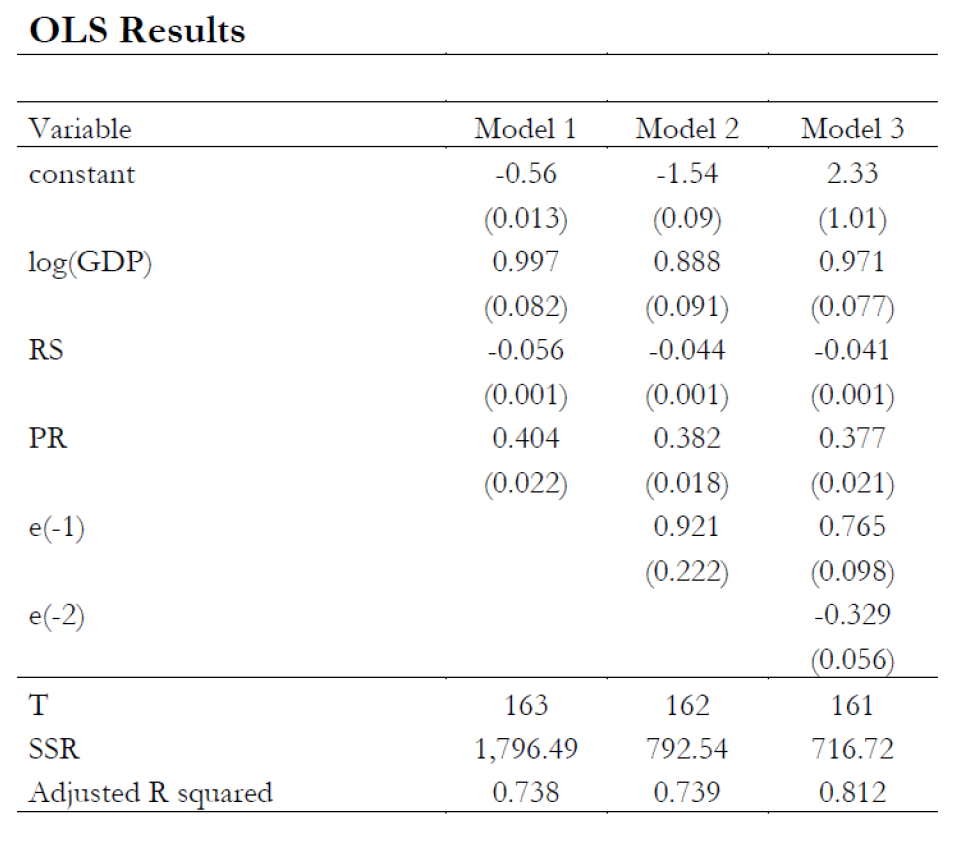
Models 2 and 3 are the estimation residuals of Model 1.
(a) (6 points) Test for autocorrelation using Model 2 at 1% significance level.
(b) (6 points) Test for autocorrelation using Model 3 at 1% significance level.
(c) (6 points) Explain the conclusion you arrive at with regard to the serial correlation
in our money demand function.
OLS Results Variable constant log(GDP) Model 1 -0.56 (0.013) 0.997 (0.082) -0.056 (0.001) 0.404 (0.022) RS Model 2 -1.54 (0.09) 0.888 (0.091) -0.044 (0.001) 0.382 (0.018) 0.921 (0.222) Model 3 2.33 (1.01) 0.971 (0.077) -0.041 (0.001) 0.377 (0.021) 0.765 (0.098) -0.329 (0.056 161 PR e(-1) e(-2) T SSR Adjusted R squared 163 1,796.49 0.738 162 792.54 0.739 716.72 0.812 OLS Results Variable constant log(GDP) Model 1 -0.56 (0.013) 0.997 (0.082) -0.056 (0.001) 0.404 (0.022) RS Model 2 -1.54 (0.09) 0.888 (0.091) -0.044 (0.001) 0.382 (0.018) 0.921 (0.222) Model 3 2.33 (1.01) 0.971 (0.077) -0.041 (0.001) 0.377 (0.021) 0.765 (0.098) -0.329 (0.056 161 PR e(-1) e(-2) T SSR Adjusted R squared 163 1,796.49 0.738 162 792.54 0.739 716.72 0.812Step by Step Solution
There are 3 Steps involved in it
Step: 1

Get Instant Access to Expert-Tailored Solutions
See step-by-step solutions with expert insights and AI powered tools for academic success
Step: 2

Step: 3
Ace Your Homework with AI
Get the answers you need in no time with our AI-driven, step-by-step assistance
Get Started
Technical Analysis Of Stock Trends
Authors: Robert D. Edwards, John Magee , W.H.C. Bassetti
11th Edition
1138069418,1351631438