Answered step by step
Verified Expert Solution
Link Copied!

Question

1 Approved Answer

a. none are correct b. only II is correct c. only I is correct d. both are correct The graphs below represent continuous probability distributions
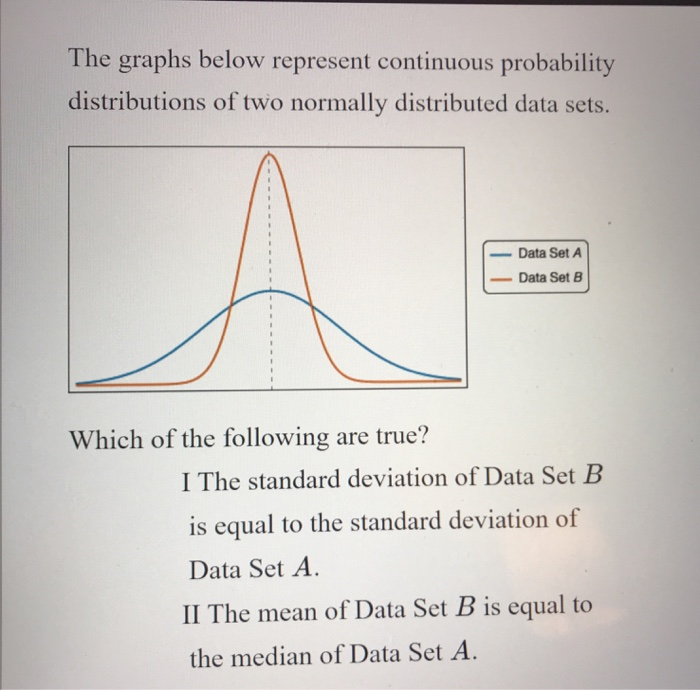
image text in transcribed
a. none are correct
b. only II is correct
c. only I is correct
d. both are correct
The graphs below represent continuous probability distributions of two normally distributed data sets. Data Set A A Data Set B Which of the following are true? I The standard deviation of Data Set B is equal to the standard deviation of Data Set A. II The mean of Data Set B is equal to the median of Data Set A

Step by Step Solution

There are 3 Steps involved in it

Step: 1

blur-text-image

Get Instant Access to Expert-Tailored Solutions

See step-by-step solutions with expert insights and AI powered tools for academic success

Step: 2

blur-text-image

Step: 3

blur-text-image

Ace Your Homework with AI

Get the answers you need in no time with our AI-driven, step-by-step assistance

Get Started

Recommended Textbook for

Audit Analytics In The Financial Industry

Authors: Jun Dai

3rd Edition

1787430863, 9781787430860

More Books

Students also viewed these Accounting questions

Question

Show that the product of the roots of a quadratic equation is c/a.

Answered: 1 week ago