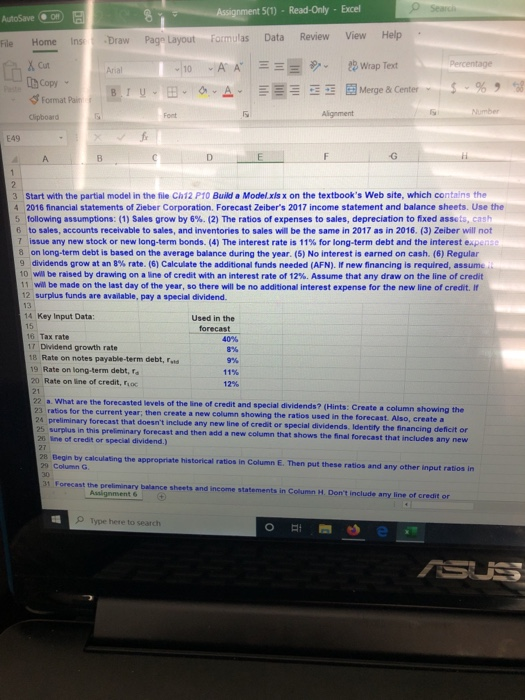
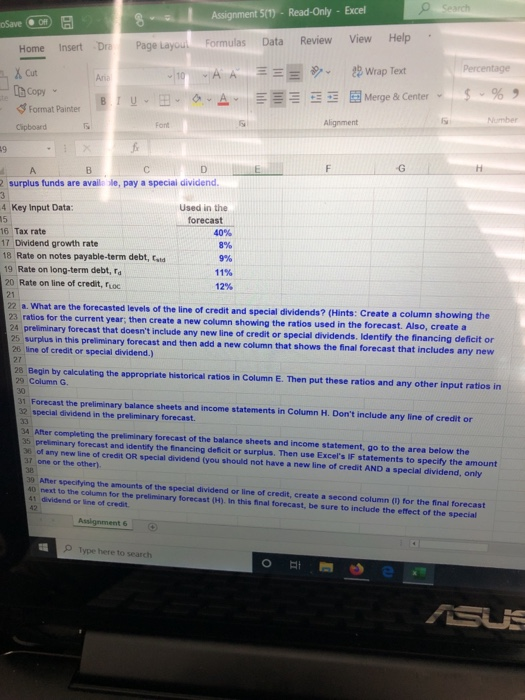
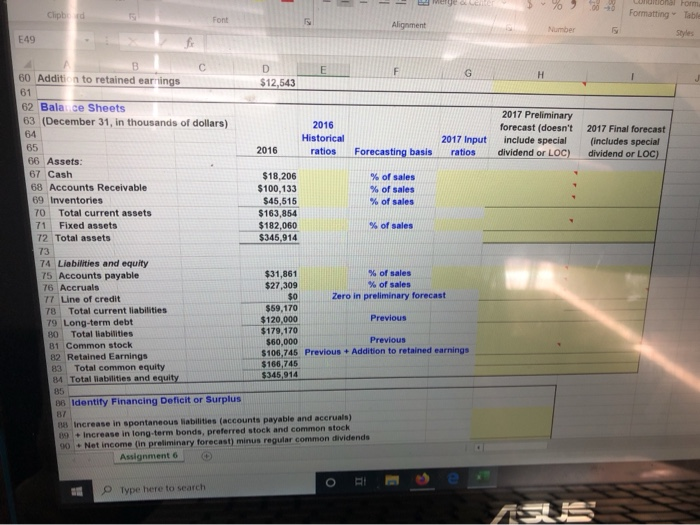
A O Search AutoSave On File Home S Draw 8 Page Layout ssignment (1) - Read-Only - Excel Formulas Data Review View ins Help 10 A Percentage RX Cut th copy Format Pain Clipboard A A 23 Wrap Text Merge & Center BU Number Font E49 3 Start with the partial model in the file Ch12 P10 Build a Model.xlsx on the textbook's Web site, which contains the 4 2016 financial statements of Zieber Corporation. Forecast Zeiber's 2017 income statement and balance sheets. Use the 5 following assumptions: (1) Sales grow by 6%. (2) The ratios of expenses to sales, depreciation to fixed assets, cash 6 to sales, accounts receivable to sales, and inventories to sales will be the same in 2017 as in 2016. (3) Zeiber will not 7 issue any new stock or new long-term bonds. (4) The interest rate is 11% for long-term debt and the interest expense 8 on long-term debt is based on the average balance during the year (5) No interest is earned on cash. (6) Regular 9 dividends grow at an 8% rate. (6) Calculate the additional funds needed (AFN). If new financing is required, assume 10 will be raised by drawing on a line of credit with an interest rate of 12%. Assume that any draw on the line of credit 11 will be made on the last day of the year, so there will be no additional interest expense for the new line of credit. If 12 surplus funds are available, pay a special dividend. 14 Key Input Data: Used in the forecast 16 Tax rate 17 Dividend growth rate 18 Rate on notes payable-term debt, 19 Rate on long-term debt.ro 20 Rate on line of credit, ac 22 What are the forecasted levels of the line of credit and special dividends? (Hints: Create a column showing the 23 ratios for the current year, then create a new column showing the ratios used in the forecast. Also, create a 24 preliminary forecast that doesn't include any new line of credit or special dividends. Identify the financing deficit or 25 surplus in this preliminary forecast and then add a new column that shows the final forecast that includes any new 25 line of credit or special dividend.) 28 Begin by calculating the appropriate historical ratios in Column E. Then put these ratios and any other input ratios in 29 Column G 31 Forecast the preliminary balance sheets and income statements in Column H. Don't include any line of creditor Assignment Type here to search OSUS le search S Assignment 5(1) - Read-Only - Excel Save OB Home Insert Dre Page Layout Formulas Data Review View Help 3 Percentage Are 10 AA == > x Cut Ib Copy Format Painter Clipboard 29 Wrap Text B Merge & Center w BU B A $ % 9 Alignment - Number " A B 2 surplus funds are available, pay a special dividend. 4 Key Input Data: Used in the forecast 40% 8% 16 Tax rate 17 Dividend growth rate 18 Rate on notes payable-term debt, ata 19 Rate on long-term debt, a 20 Rate on line of credit, roc 11% 22. What are the forecasted levels of the line of credit and special dividends? (Hints: Create a column showing the 23 ratios for the current year; then create a new column showing the ratios used in the forecast. Also, create a 24 preliminary forecast that doesn't include any new line of credit or special dividends. Identify the financing deficit or 25 surplus in this preliminary forecast and then add a new column that shows the final forecast that includes any new 26 line of credit or special dividend.) 28 Begin by calculating the appropriate historical ratios in Column E. Then put these ratios and any other input ratios in 29 Column G. 31 Forecast the preliminary balance sheets and income statements in Column H. Don't include any line of creditor 32 special dividend in the preliminary forecast. 34 After completing the preliminary forecast of the balance sheets and income statement, go to the area below the 35 preliminary forecast and identity the financing deficit or surplus. Then use Excel's IF statements to specify the amount 36 of any new line of credit OR special dividend you should not have a new line of credit AND a special dividend, only 37 one or the other) 30 Aer specifying the amounts of the special dividend or line of credit, create a second column() for the final forecast AD next to the column for the preliminary forecast (H). In this final forecast, be sure to include the effect of the special 41 dividend or line of credit Assignment 6 Type here to search - - - - Meru Clipbed Conditional Form Formatting Table Alignment Number E49 H $12,543 60 Addition to retained earnings 61 62 Bala ce Sheets 63 (December 31, in thousands of dollars) 64 2016 Historical ratios 2017 Preliminary forecast (doesn't include special dividend or LOC) 2017 Final forecast (includes special dividend or LOC) 2016 2017 Input ratios Forecasting basis 65 66 Assets: 67 Cash 68 Accounts Receivable 69 Inventories 70 Total current assets 71 Fixed assets 72 Total assets $18,206 $100,133 $45,515 $163,854 $182,060 $345,914 % of sales % of sales % of sales % of sales 74 Liabilities and equity 75 Accounts payable 76 Accruals TT Line of credit 78 Total current liabilities 79 Long-term debt 80 Total liabilities 81 Common stock 82 Retained Earnings 83 Total common equity 84 Total liabilities and equity $31,861 % of sales $27,309 % of sales $0 Zero in preliminary forecast $69,170 $120,000 Previous $179,170 $60,000 Previous $106,745 Previous + Addition to retained earnings $166,745 $345,914 36 Identity Financing Deficit or Surplus B7 BIncrease in spontaneous liabilities (accounts payable and accruals) Increase in long-term bonds, preferred stock and common stock 90 Net Income (in preliminary forecast) minus regular common dividends Assignment 6 Type here to search A O Search AutoSave On File Home S Draw 8 Page Layout ssignment (1) - Read-Only - Excel Formulas Data Review View ins Help 10 A Percentage RX Cut th copy Format Pain Clipboard A A 23 Wrap Text Merge & Center BU Number Font E49 3 Start with the partial model in the file Ch12 P10 Build a Model.xlsx on the textbook's Web site, which contains the 4 2016 financial statements of Zieber Corporation. Forecast Zeiber's 2017 income statement and balance sheets. Use the 5 following assumptions: (1) Sales grow by 6%. (2) The ratios of expenses to sales, depreciation to fixed assets, cash 6 to sales, accounts receivable to sales, and inventories to sales will be the same in 2017 as in 2016. (3) Zeiber will not 7 issue any new stock or new long-term bonds. (4) The interest rate is 11% for long-term debt and the interest expense 8 on long-term debt is based on the average balance during the year (5) No interest is earned on cash. (6) Regular 9 dividends grow at an 8% rate. (6) Calculate the additional funds needed (AFN). If new financing is required, assume 10 will be raised by drawing on a line of credit with an interest rate of 12%. Assume that any draw on the line of credit 11 will be made on the last day of the year, so there will be no additional interest expense for the new line of credit. If 12 surplus funds are available, pay a special dividend. 14 Key Input Data: Used in the forecast 16 Tax rate 17 Dividend growth rate 18 Rate on notes payable-term debt, 19 Rate on long-term debt.ro 20 Rate on line of credit, ac 22 What are the forecasted levels of the line of credit and special dividends? (Hints: Create a column showing the 23 ratios for the current year, then create a new column showing the ratios used in the forecast. Also, create a 24 preliminary forecast that doesn't include any new line of credit or special dividends. Identify the financing deficit or 25 surplus in this preliminary forecast and then add a new column that shows the final forecast that includes any new 25 line of credit or special dividend.) 28 Begin by calculating the appropriate historical ratios in Column E. Then put these ratios and any other input ratios in 29 Column G 31 Forecast the preliminary balance sheets and income statements in Column H. Don't include any line of creditor Assignment Type here to search OSUS le search S Assignment 5(1) - Read-Only - Excel Save OB Home Insert Dre Page Layout Formulas Data Review View Help 3 Percentage Are 10 AA == > x Cut Ib Copy Format Painter Clipboard 29 Wrap Text B Merge & Center w BU B A $ % 9 Alignment - Number " A B 2 surplus funds are available, pay a special dividend. 4 Key Input Data: Used in the forecast 40% 8% 16 Tax rate 17 Dividend growth rate 18 Rate on notes payable-term debt, ata 19 Rate on long-term debt, a 20 Rate on line of credit, roc 11% 22. What are the forecasted levels of the line of credit and special dividends? (Hints: Create a column showing the 23 ratios for the current year; then create a new column showing the ratios used in the forecast. Also, create a 24 preliminary forecast that doesn't include any new line of credit or special dividends. Identify the financing deficit or 25 surplus in this preliminary forecast and then add a new column that shows the final forecast that includes any new 26 line of credit or special dividend.) 28 Begin by calculating the appropriate historical ratios in Column E. Then put these ratios and any other input ratios in 29 Column G. 31 Forecast the preliminary balance sheets and income statements in Column H. Don't include any line of creditor 32 special dividend in the preliminary forecast. 34 After completing the preliminary forecast of the balance sheets and income statement, go to the area below the 35 preliminary forecast and identity the financing deficit or surplus. Then use Excel's IF statements to specify the amount 36 of any new line of credit OR special dividend you should not have a new line of credit AND a special dividend, only 37 one or the other) 30 Aer specifying the amounts of the special dividend or line of credit, create a second column() for the final forecast AD next to the column for the preliminary forecast (H). In this final forecast, be sure to include the effect of the special 41 dividend or line of credit Assignment 6 Type here to search - - - - Meru Clipbed Conditional Form Formatting Table Alignment Number E49 H $12,543 60 Addition to retained earnings 61 62 Bala ce Sheets 63 (December 31, in thousands of dollars) 64 2016 Historical ratios 2017 Preliminary forecast (doesn't include special dividend or LOC) 2017 Final forecast (includes special dividend or LOC) 2016 2017 Input ratios Forecasting basis 65 66 Assets: 67 Cash 68 Accounts Receivable 69 Inventories 70 Total current assets 71 Fixed assets 72 Total assets $18,206 $100,133 $45,515 $163,854 $182,060 $345,914 % of sales % of sales % of sales % of sales 74 Liabilities and equity 75 Accounts payable 76 Accruals TT Line of credit 78 Total current liabilities 79 Long-term debt 80 Total liabilities 81 Common stock 82 Retained Earnings 83 Total common equity 84 Total liabilities and equity $31,861 % of sales $27,309 % of sales $0 Zero in preliminary forecast $69,170 $120,000 Previous $179,170 $60,000 Previous $106,745 Previous + Addition to retained earnings $166,745 $345,914 36 Identity Financing Deficit or Surplus B7 BIncrease in spontaneous liabilities (accounts payable and accruals) Increase in long-term bonds, preferred stock and common stock 90 Net Income (in preliminary forecast) minus regular common dividends Assignment 6 Type here to search