Answered step by step
Verified Expert Solution
Link Copied!

Question

1 Approved Answer

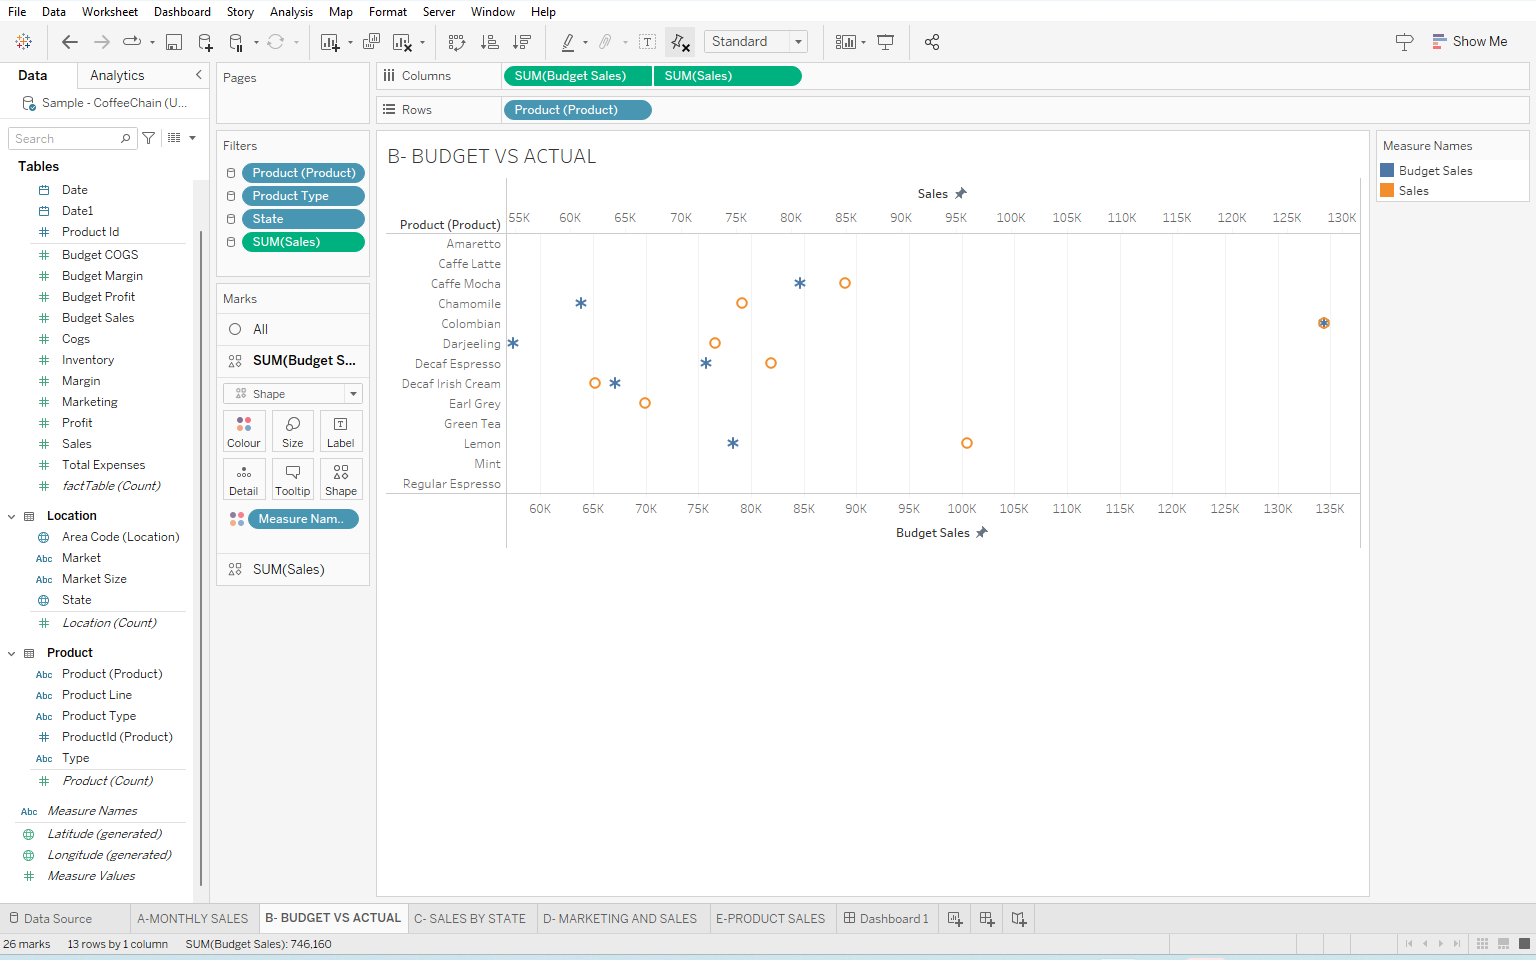
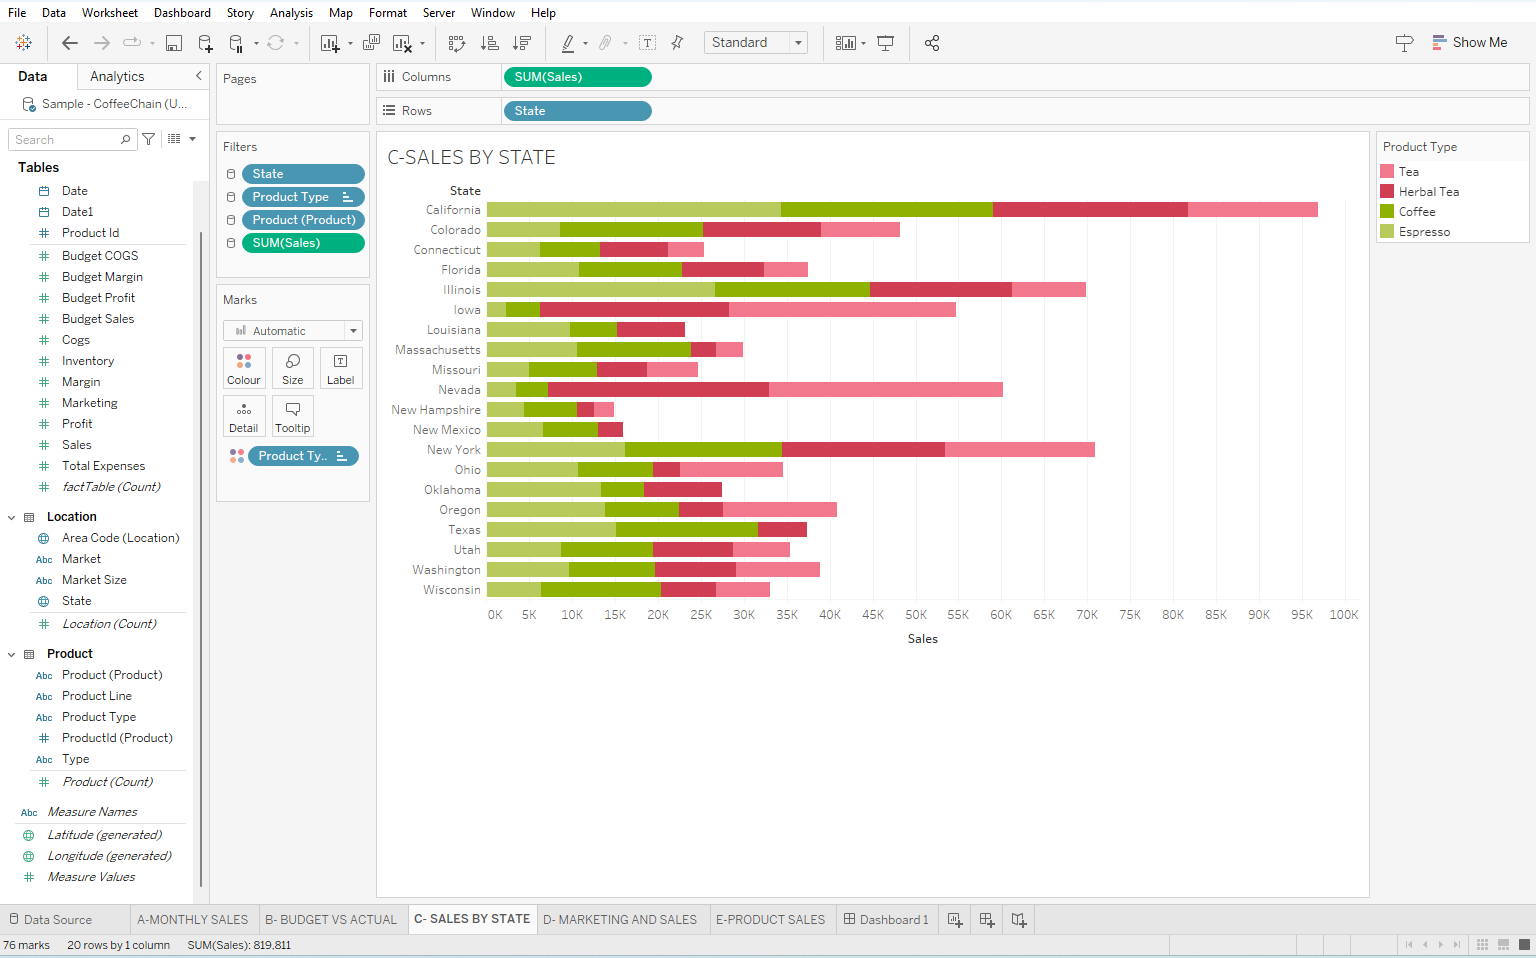
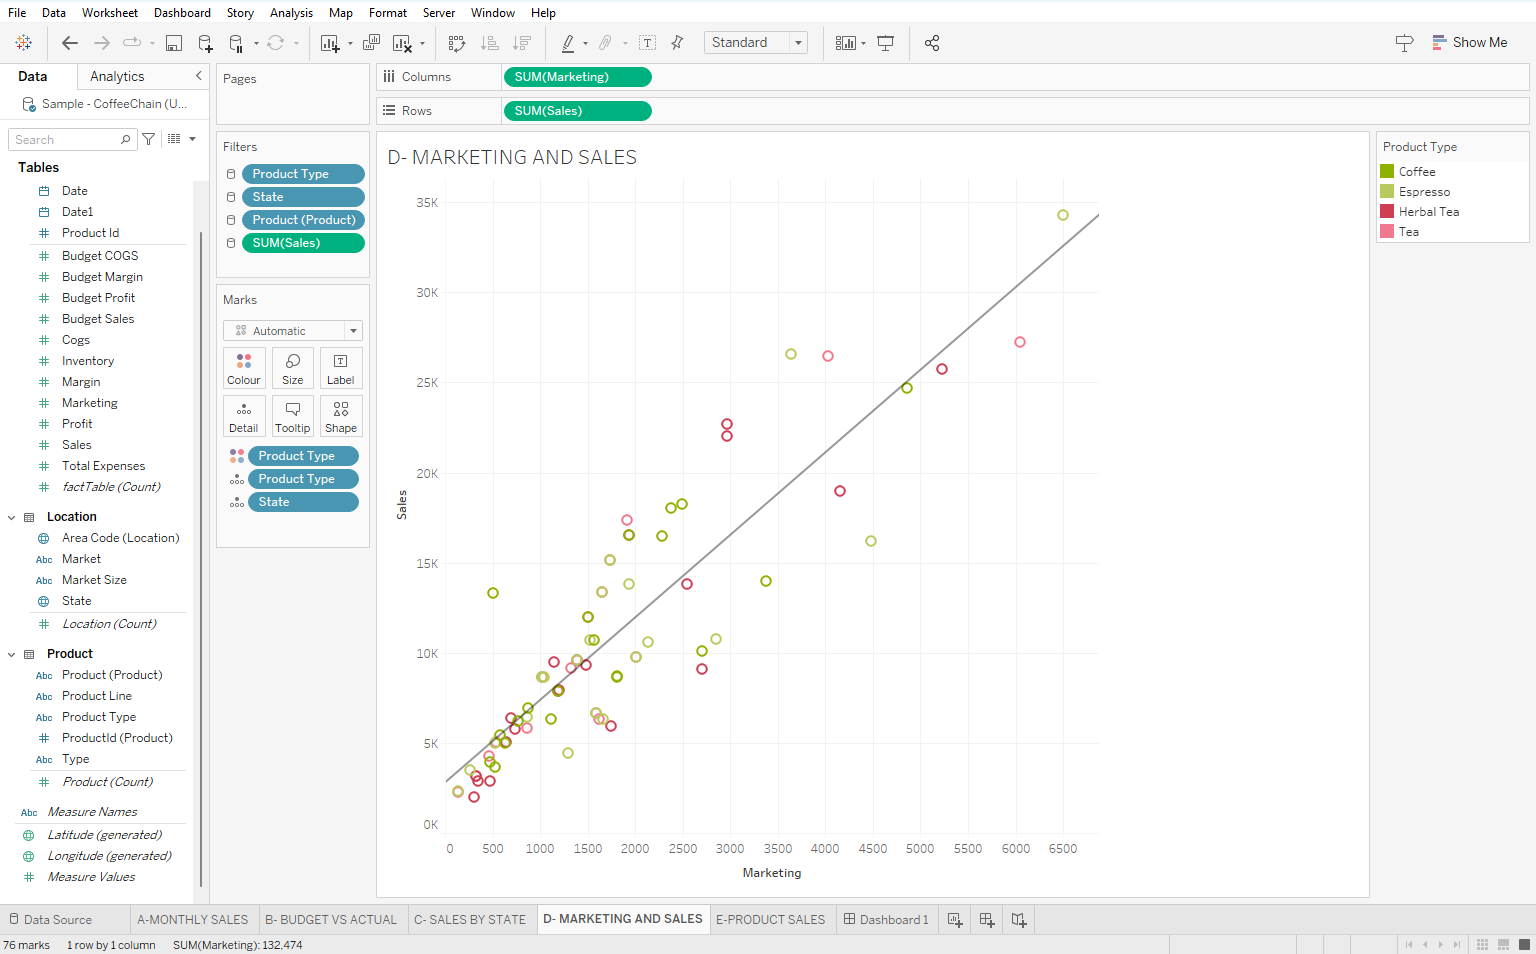
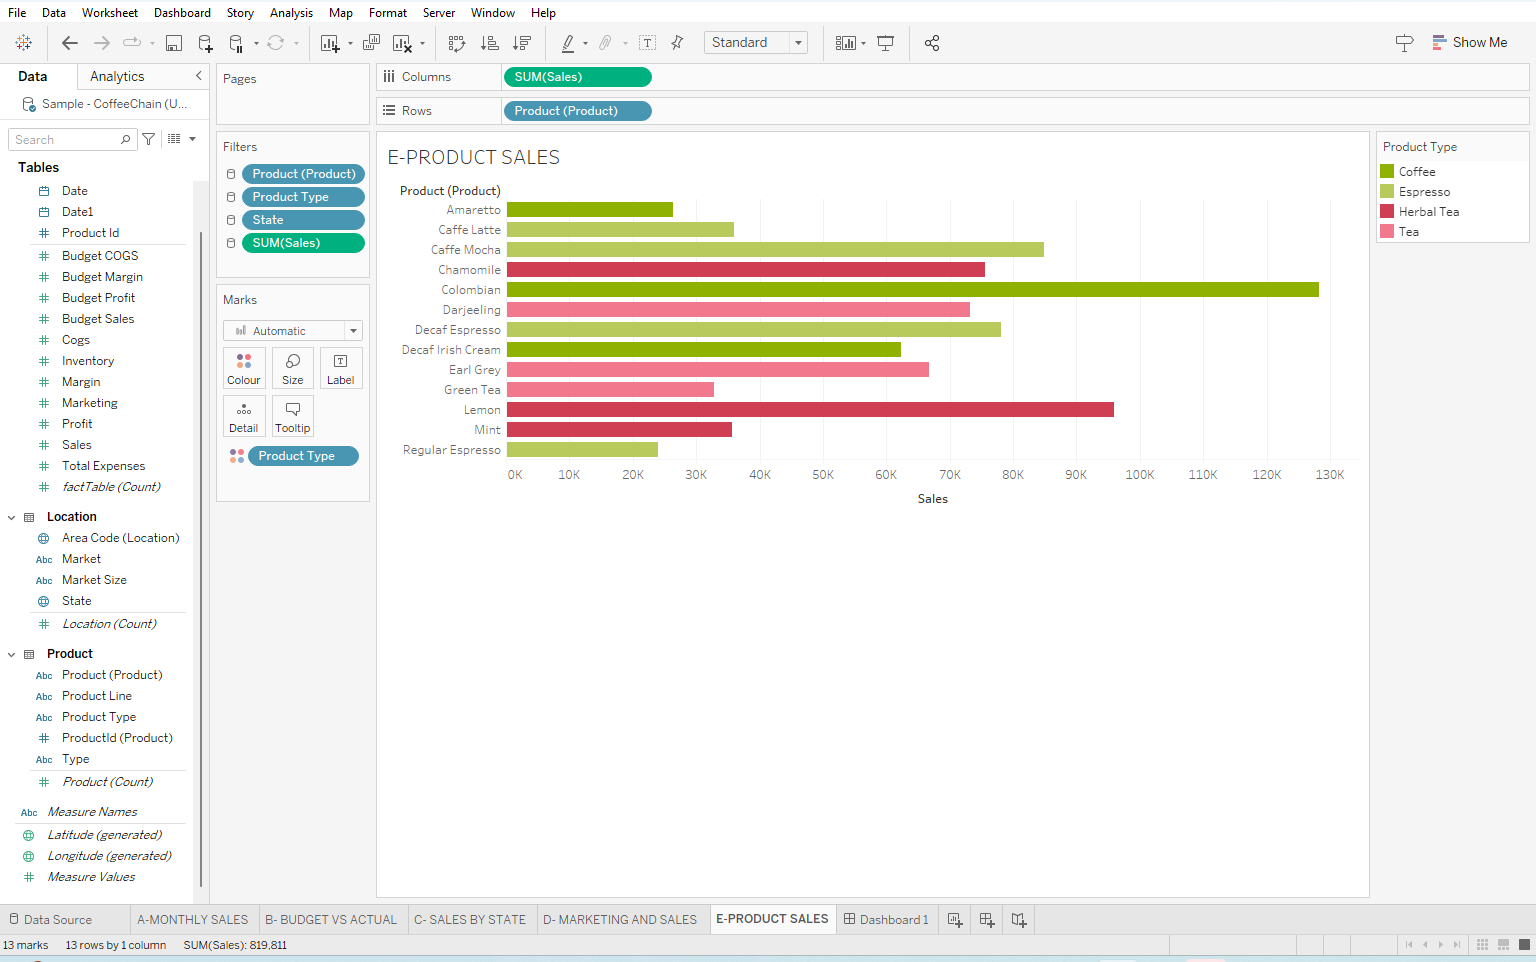
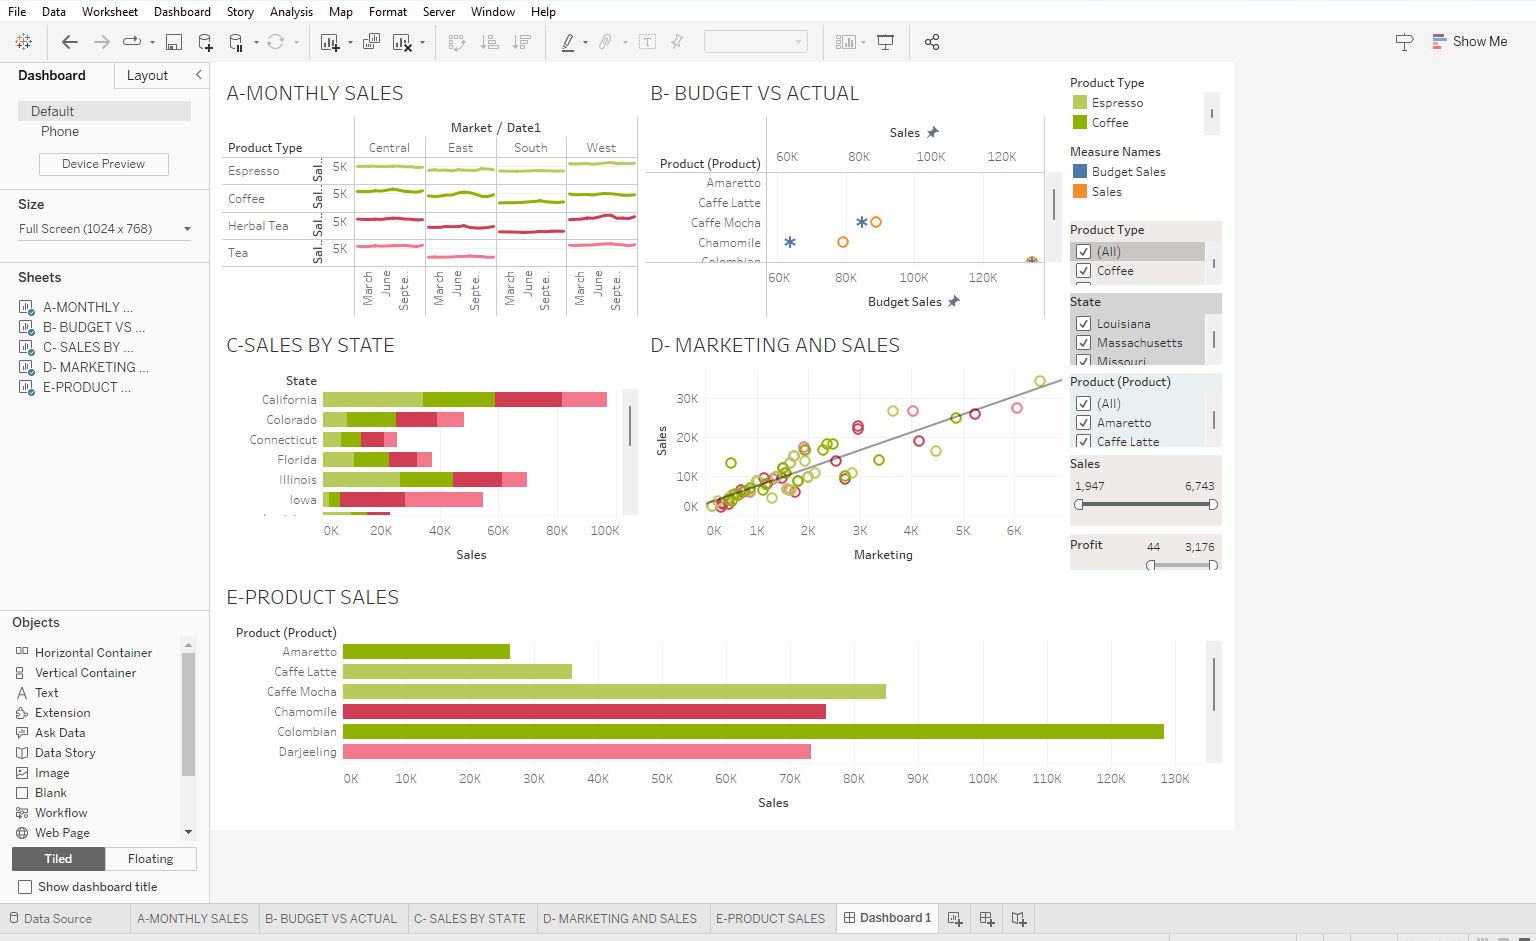
A page is needed for the reverse Engineering. This should describe the elements (filters, colors, shapes etc) included and navigation implemented in each sheet and

A page is needed for the reverse Engineering. This should describe the elements (filters, colors, shapes etc) included and navigation implemented in each sheet and across sheets in the dashboard. One short paragraph each for each sheet (A,B,C,D,E) and one paragraph for the dashboard is needed.

I have uploaded the images below.
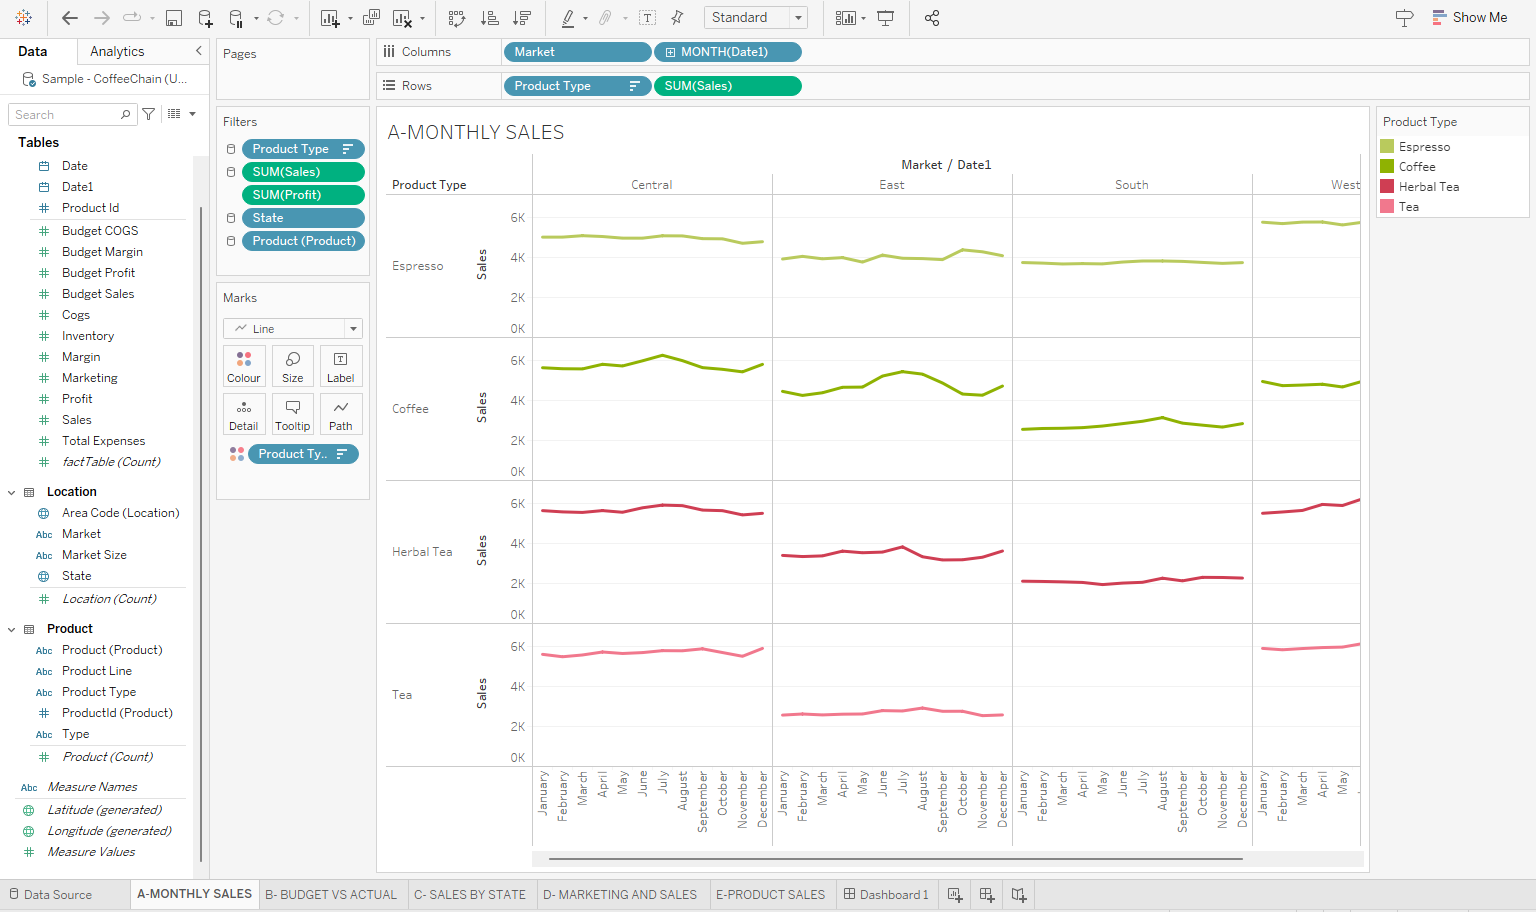
image text in transcribedimage text in transcribedimage text in transcribedimage text in transcribedimage text in transcribedimage text in transcribed
Standard Show Me Analytics Pages Market MONTH(Date1) Data iii Columns Sample - CoffeeChain (U... Rows Product Type F SUM(Sales) Product Type Search Filters A-MONTHLY SALES Espresso Tables Product Type F Market / Datel Coffee Date SUM(Sales South West Central East Herbal Tea Datel Product Type SUM(Profit) Tea # Product Id State 6K # Budget COGS 9 Product (Product) # Budget Margin 4K Sales Espresso # Budget Profit # Budget Sales Marks 2K Cogs ~ Line OK # Inventory # Margin T 6K # Marketing Colour Size Label # Profit 4K 000 N Coffee Sales # Detai Tooltip Path # Total Expenses 2K # factTable (Count) Product Ty.. OK Location 6K @ Area Code (Location) Abc Market 4K Sales Abc Market Size Herbal Tea State 2K # Location (Count) OK Product 6K Abc Product (Product) Abc Product Line 4K Abc Product Type Tea Sales # Productld (Product) 2K Abc Type # Product (Count) OK May July April May June July April March July May June March April August May June October April August January March February October January March August February December Abc Measure Names October November January September February December January December September November February November September @ Latitude (generated) @ Longitude (generated) # Measure Values 04 Data Source A-MONTHLY SALES B- BUDGET VS ACTUAL C- SALES BY STATE D- MARKETING AND SALES E-PRODUCT SALES # Dashboard 1File Data Worksheet Dashboard Story Analysis Map Format Server Window Help Standard Y 7 Show Me Data Analytics

Step by Step Solution

There are 3 Steps involved in it

Step: 1

blur-text-image

Get Instant Access to Expert-Tailored Solutions

See step-by-step solutions with expert insights and AI powered tools for academic success

Step: 2

blur-text-image

Step: 3

blur-text-image

Ace Your Homework with AI

Get the answers you need in no time with our AI-driven, step-by-step assistance

Get Started

Recommended Textbook for

Transportation A Global Supply Chain Perspective

Authors: John J. Coyle, Robert A. Novak, Brian Gibson, Edward J. Bard

8th edition

9781305445352, 1133592961, 130544535X, 978-1133592969

More Books

Students also viewed these Mathematics questions

Question

Explain the law of demand and exceptions to the law.

Answered: 1 week ago