Question
A paper manufacturing company has to control the thickness of cardboard sheets produced. Random samples of size 5 are selected and the thickness is recorded.
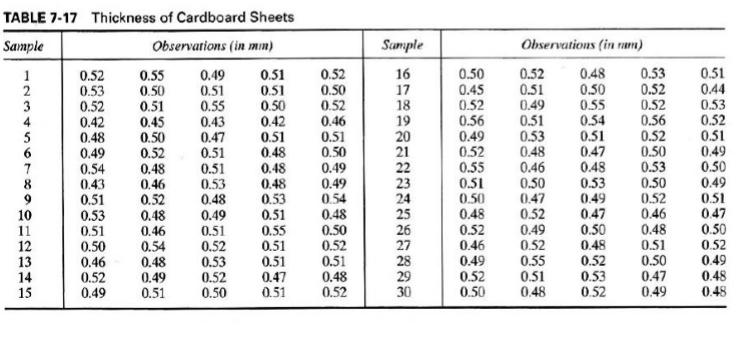
A paper manufacturing company has to control the thickness of cardboard sheets produced. Random samples of size 5 are selected and the thickness is recorded. Table 7-17 shows the data for 30 samples. The specifications on thickness are 0.5 ± 0.04 mm. _
a. Find the trial control limits for the X- and R-charts.
b. Assuming special causes for out-of-control points, find the revised control limits.
c. What is the estimate of the process mean and the process standard deviation?
d. What proportion of the output is nonconforming?
e. If the process mean shifts to 0.48 mm, what is the probability of detecting it on the first sample drawn after the shift?
f. What proportion of the output will be nonconforming at this shifted
TABLE 7-17 Thickness of Cardboard Sheets Sample Observations (in mm) Sample Observations (in ram) 0.50 0.45 0.52 0.56 0.49 0.52 0.55 0.51 0.50 0.48 0.48 0.50 0.53 0.52 0.52 0.56 0.52 0.50 0.53 0.50 0.52 0.46 0.48 0.51 0.44 0.53 0.52 0.51 0.49 0.50 0.49 0.51 0.47 0.50 0.55 0.49 0.51 0.55 0.43 0.47 0.51 0.52 0.50 0.52 0.46 0.51 0.50 16 17 18 0.52 0.53 0.52 0.42 0.48 0.49 0.54 0.43 0.51 0.53 0.52 0.51 0.49 0.51 0.53 0.48 0.46 0.50 0.47 0.52 0.49 0.52 0.55 0.51 0.48 0.50 0.51 0.45 0.50 0.52 0.48 0.51 0.51 0.50 0.42 0.51 0.48 0.48 19 20 21 22 23 24 25 0.55 0.54 0.51 0.47 0.48 0.53 0.49 0.47 0.50 0.48 0.52 4 5 0.49 0.49 0.51 0.53 0.48 0.49 0.51 0.52 0.53 0.52 0.50 8 0.46 0.48 0.53 0.51 0.55 0.51 0.51 0.52 0.48 10 11 12 13 14 0.54 0.48 0.50 0.52 0.51 0.48 0.52 26 0.51 0.50 0.46 0.52 0.49 0.46 0.54 0.48 0.49 0.51 0.52 0.46 0.49 0.52 0.50 27 0.51 0.50 0.47 0.49 0.52 0.49 0.47 0.51 28 29 30 0.53 0.52 0.48 0.48 15 123
Step by Step Solution
3.53 Rating (160 Votes )
There are 3 Steps involved in it
Step: 1
4 Sub questions per solution a R chart hange Xmax X...
Get Instant Access to Expert-Tailored Solutions
See step-by-step solutions with expert insights and AI powered tools for academic success
Step: 2

Step: 3

Ace Your Homework with AI
Get the answers you need in no time with our AI-driven, step-by-step assistance
Get Started


