Answered step by step
Verified Expert Solution
Link Copied!

Question

1 Approved Answer

a. Plot the following functions using MATLAB y=a* Sin (x+b) Plot three different lines on the same plot by assuming 1. a=b=0.125 and x(0,10) 2.
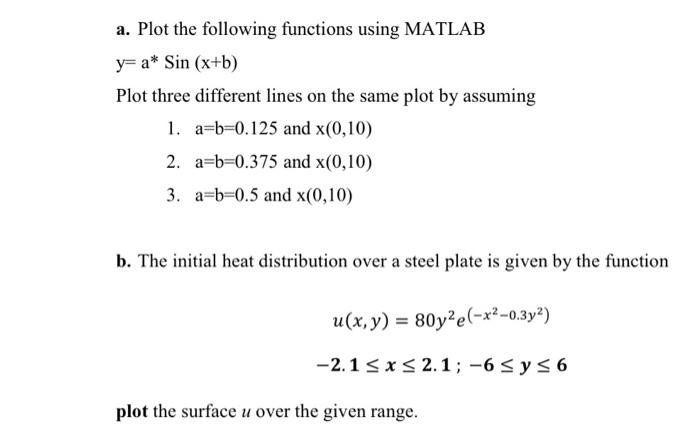
image text in transcribed
a. Plot the following functions using MATLAB y=a* Sin (x+b) Plot three different lines on the same plot by assuming 1. a=b=0.125 and x(0,10) 2. a=b=0.375 and x(0,10) 3. a=b=0.5 and x(0,10) b. The initial heat distribution over a steel plate is given by the function u(x, y) = 80y2el-x2-0.3y2) -2.1sx52.1; -6 sy s6 plot the surface u over the given range

Step by Step Solution

There are 3 Steps involved in it

Step: 1

blur-text-image

Get Instant Access to Expert-Tailored Solutions

See step-by-step solutions with expert insights and AI powered tools for academic success

Step: 2

blur-text-image_2

Step: 3

blur-text-image_3

Ace Your Homework with AI

Get the answers you need in no time with our AI-driven, step-by-step assistance

Get Started

Recommended Textbook for

Introduction To Chemical Engineering Thermodynamics

Authors: J.M. Smith, Mark Swihart Hendrick C. Van Ness, Michael Abbott

9th International Edition

1260597687, 978-1260597684

More Books

Students also viewed these Chemical Engineering questions

Question

=+ Who will have which specific IJV recruitment responsibilities?

Answered: 1 week ago