

Answered step by step
Verified Expert Solution
Question
1 Approved Answer
a. Plot the series and explain what can be learned from this plot. b. Calculate the first 24 autocorrelations for the series, and explain what
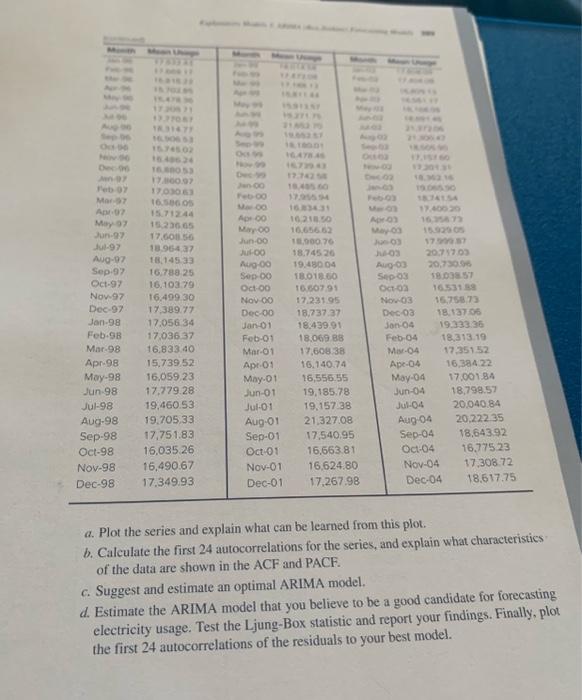
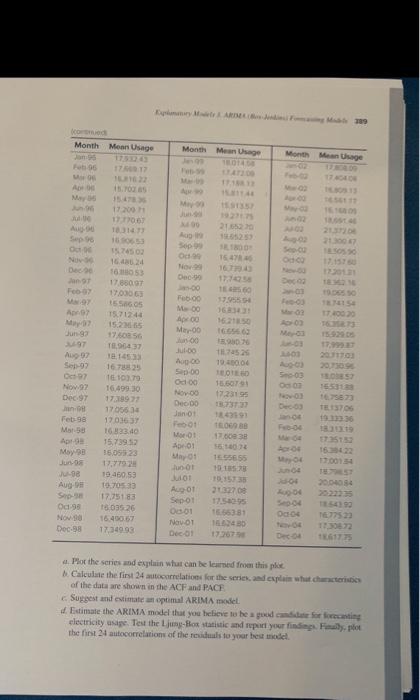
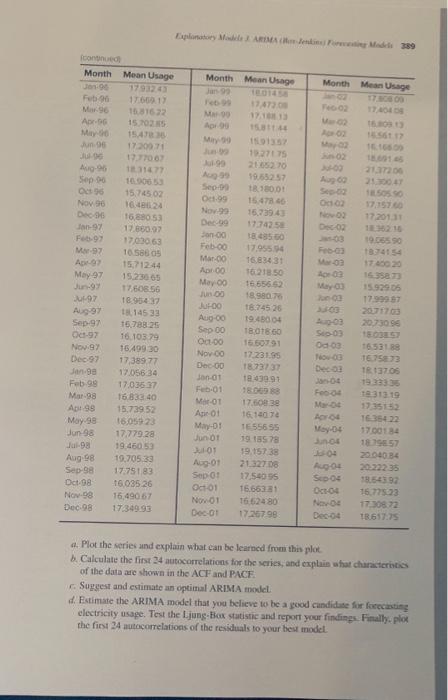
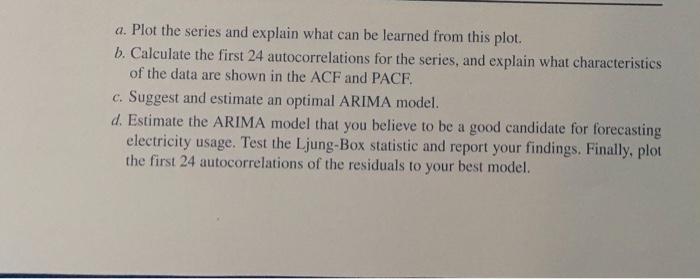 a. Plot the series and explain what can be learned from this plot. b. Calculate the first 24 autocorrelations for the series, and explain what characteristics of the data are shown in the ACF and PACF. c. Suggest and estimate an optimal ARIMA model. d. Estimate the ARIMA model that you believe to be a good candidate for forecasting electricity usage. Test the Ljung-Box statistic and report your findings. Finally, plot the first 24 autocorrelations of the residuals to your best model. 4. Phot the series and explain whar can be learsed foom this phee. of the data ane shinus in the ACF and PACF 6. Suggest and evitmate an opitimal ARIMA mosel. the fint 24 autiococrelations of the revituals to yoar bes tricel. a. Plot the series und explain what can be learned from thit plok b. Calculate the fint 24 autoconrelations for the series, and exphais a fat characterintis: of the data are shown in the ACF and PNCF. 5. Suggest and estimate an optimal ARIMA tooklel. d. Fstimate the ARIMA model that you believe to be a good candidate for forecating electricity usage, Test the Ljung-fios statistic and report your fincings. Finally. plote the fint 24 autacomelations of the residuals to your bes model. a. Plot the series and explain what can be learned from this plot. b. Calculate the first 24 autocorrelations for the series, and explain what characteristics of the data are shown in the ACF and PACF. c. Suggest and estimate an optimal ARIMA model. d. Estimate the ARIMA model that you believe to be a good candidate for forecasting electricity usage. Test the Ljung-Box statistic and report your findings. Finally, plot the first 24 autocorrelations of the residuals to your best model. a. Plot the series and explain what can be learned from this plot. b. Calculate the first 24 autocorrelations for the series, and explain what characteristics of the data are shown in the ACF and PACF. c. Suggest and estimate an optimal ARIMA model. d. Estimate the ARIMA model that you believe to be a good candidate for forecasting electricity usage. Test the Ljung-Box statistic and report your findings. Finally, plot the first 24 autocorrelations of the residuals to your best model. 4. Phot the series and explain whar can be learsed foom this phee. of the data ane shinus in the ACF and PACF 6. Suggest and evitmate an opitimal ARIMA mosel. the fint 24 autiococrelations of the revituals to yoar bes tricel. a. Plot the series und explain what can be learned from thit plok b. Calculate the fint 24 autoconrelations for the series, and exphais a fat characterintis: of the data are shown in the ACF and PNCF. 5. Suggest and estimate an optimal ARIMA tooklel. d. Fstimate the ARIMA model that you believe to be a good candidate for forecating electricity usage, Test the Ljung-fios statistic and report your fincings. Finally. plote the fint 24 autacomelations of the residuals to your bes model. a. Plot the series and explain what can be learned from this plot. b. Calculate the first 24 autocorrelations for the series, and explain what characteristics of the data are shown in the ACF and PACF. c. Suggest and estimate an optimal ARIMA model. d. Estimate the ARIMA model that you believe to be a good candidate for forecasting electricity usage. Test the Ljung-Box statistic and report your findings. Finally, plot the first 24 autocorrelations of the residuals to your best model
Step by Step Solution
There are 3 Steps involved in it
Step: 1

Get Instant Access to Expert-Tailored Solutions
See step-by-step solutions with expert insights and AI powered tools for academic success
Step: 2

Step: 3
Ace Your Homework with AI
Get the answers you need in no time with our AI-driven, step-by-step assistance
Get Started
Financial Accounting An International Introduction
Authors: David Alexander, Christopher Nobe
6th Edition
1292102993, 978-1292102993