Question
A portfolio manager observed the performance of two (2) stocks in his portfolio over a four year period. The data collected was historical data

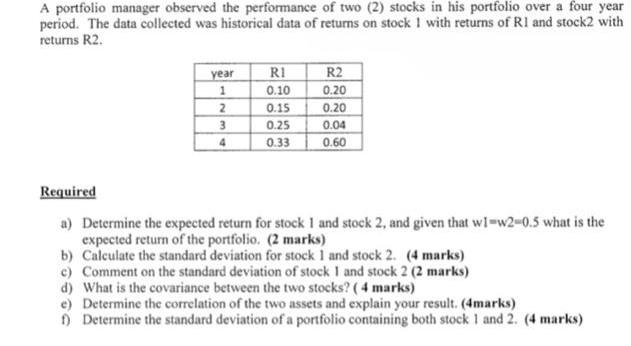
A portfolio manager observed the performance of two (2) stocks in his portfolio over a four year period. The data collected was historical data of returns on stock 1 with returns of R1 and stock2 with returns R2. year RI R2 1 0.10 0.20 2 0.15 0.20 3 0.25 0.04 4 0.33 0.60 Required a) Determine the expected return for stock 1 and stock 2, and given that wl-w2-0.5 what is the expected return of the portfolio. (2 marks) b) Calculate the standard deviation for stock 1 and stock 2. (4 marks) c) Comment on the standard deviation of stock 1 and stock 2 (2 marks) d) What is the covariance between the two stocks? (4 marks) e) Determine the correlation of the two assets and explain your result. (4marks) f) Determine the standard deviation of a portfolio containing both stock 1 and 2. (4 marks)
Step by Step Solution
There are 3 Steps involved in it
Step: 1

Get Instant Access to Expert-Tailored Solutions
See step-by-step solutions with expert insights and AI powered tools for academic success
Step: 2

Step: 3

Ace Your Homework with AI
Get the answers you need in no time with our AI-driven, step-by-step assistance
Get StartedRecommended Textbook for
Statistics For Business Decision Making And Analysis
Authors: Robert Stine, Dean Foster
2nd Edition
978-0321836519, 321836510, 978-0321890269
Students also viewed these Finance questions
Question
Answered: 1 week ago
Question
Answered: 1 week ago
Question
Answered: 1 week ago
Question
Answered: 1 week ago
Question
Answered: 1 week ago
Question
Answered: 1 week ago
Question
Answered: 1 week ago
Question
Answered: 1 week ago
Question
Answered: 1 week ago
Question
Answered: 1 week ago
Question
Answered: 1 week ago
Question
Answered: 1 week ago
Question
Answered: 1 week ago
Question
Answered: 1 week ago
Question
Answered: 1 week ago
Question
Answered: 1 week ago
Question
Answered: 1 week ago
Question
Answered: 1 week ago
Question
Answered: 1 week ago
Question
Answered: 1 week ago
Question
Answered: 1 week ago
Question
Answered: 1 week ago
View Answer in SolutionInn App


