

Answered step by step
Verified Expert Solution
Question
1 Approved Answer
A portfolio manager summarizes the input from the macro and micro forecasters in the following table: Micro Forecasts Residual Expected Standard Return Deviation Asset (%)
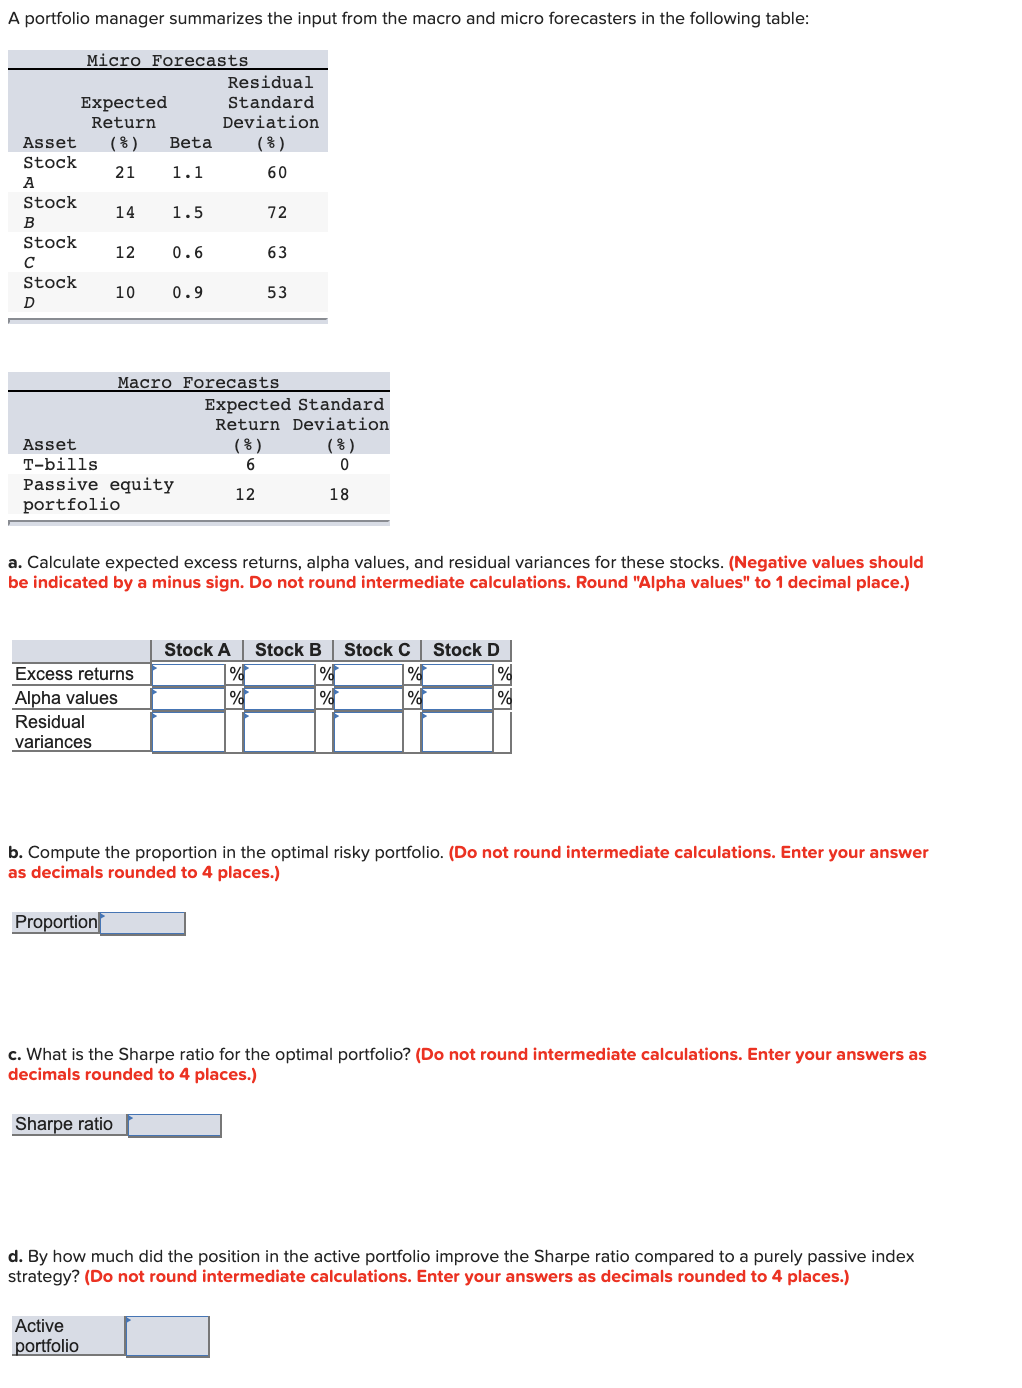
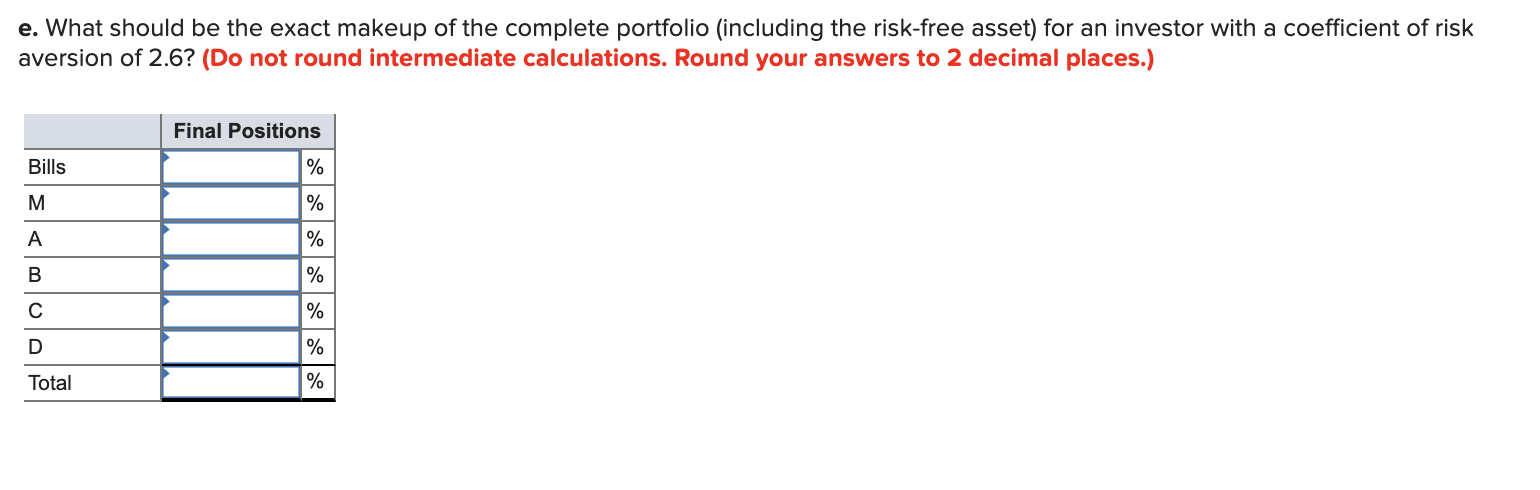
A portfolio manager summarizes the input from the macro and micro forecasters in the following table: Micro Forecasts Residual Expected Standard Return Deviation Asset (%) Beta (%) Stock 21 1.1 60 Stock 14 1.5 Stock 0.6 Stock 10 0.9 53 Macro Forecasts Expected Standard Return Deviation Asset (%) (%) T-bills Passive equity 12 portfolio 0 18 a. Calculate expected excess returns, alpha values, and residual variances for these stocks. (Negative values should be indicated by a minus sign. Do not round intermediate calculations. Round "Alpha values" to 1 decimal place.) Stock A Stock B Stock C Stock D Excess returns Alpha values Residual variances b. Compute the proportion in the optimal risky portfolio. (Do not round intermediate calculations. Enter your answer as decimals rounded to 4 places.) Proportion c. What is the Sharpe ratio for the optimal portfolio? (Do not round intermediate calculations. Enter your answers as decimals rounded to 4 places.) Sharpe ratio d. By how much did the position in the active portfolio improve the Sharpe ratio compared to a purely passive index strategy? (Do not round intermediate calculations. Enter your answers as decimals rounded to 4 places.) Active portfolio e. What should be the exact makeup of the complete portfolio (including the risk-free asset) for an investor with a coefficient of risk aversion of 2.6? (Do not round intermediate calculations. Round your answers to 2 decimal places.) Final Positions Bills M Total A portfolio manager summarizes the input from the macro and micro forecasters in the following table: Micro Forecasts Residual Expected Standard Return Deviation Asset (%) Beta (%) Stock 21 1.1 60 Stock 14 1.5 Stock 0.6 Stock 10 0.9 53 Macro Forecasts Expected Standard Return Deviation Asset (%) (%) T-bills Passive equity 12 portfolio 0 18 a. Calculate expected excess returns, alpha values, and residual variances for these stocks. (Negative values should be indicated by a minus sign. Do not round intermediate calculations. Round "Alpha values" to 1 decimal place.) Stock A Stock B Stock C Stock D Excess returns Alpha values Residual variances b. Compute the proportion in the optimal risky portfolio. (Do not round intermediate calculations. Enter your answer as decimals rounded to 4 places.) Proportion c. What is the Sharpe ratio for the optimal portfolio? (Do not round intermediate calculations. Enter your answers as decimals rounded to 4 places.) Sharpe ratio d. By how much did the position in the active portfolio improve the Sharpe ratio compared to a purely passive index strategy? (Do not round intermediate calculations. Enter your answers as decimals rounded to 4 places.) Active portfolio e. What should be the exact makeup of the complete portfolio (including the risk-free asset) for an investor with a coefficient of risk aversion of 2.6? (Do not round intermediate calculations. Round your answers to 2 decimal places.) Final Positions Bills M Total
Step by Step Solution
There are 3 Steps involved in it
Step: 1

Get Instant Access to Expert-Tailored Solutions
See step-by-step solutions with expert insights and AI powered tools for academic success
Step: 2

Step: 3
Ace Your Homework with AI
Get the answers you need in no time with our AI-driven, step-by-step assistance
Get Started
QFinance The Ultimate Resource
Authors: Various Authors
1st Edition
1849300003, 978-1849300001