Answered step by step
Verified Expert Solution
Link Copied!

Question

1 Approved Answer

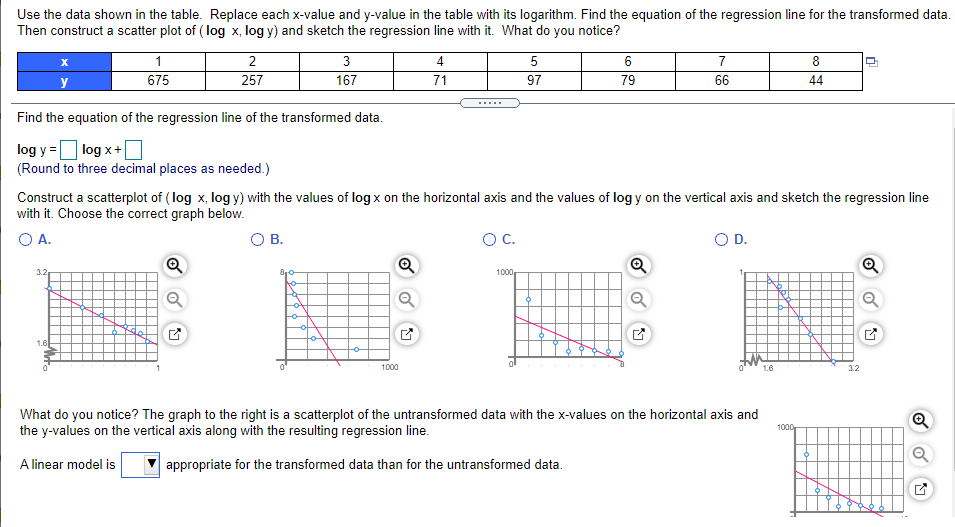
A power equation is a nonlinear regression equation of the form y = ax . Use a technology tool to find and graph the power

image text in transcribedimage text in transcribedimage text in transcribedimage text in transcribedimage text in transcribed

image text in transcribedimage text in transcribedimage text in transcribedimage text in transcribedimage text in transcribedimage text in transcribedimage text in transcribed
A power equation is a nonlinear regression equation of the form y = ax" . Use a technology tool to find and graph the power equation for the data below. Include a scatter plot in your graph. Note that you can also find this model by solving the equation logy = m( log x) + b. Click the icon to view the data set. . . . . . Use technology to find the graph of the data. Choose the correct answer below O A. O B. O C. OD. 600- 700- AY 600- 700- 10 Ty 450- 500- 600-7 400-7 500- 8- 300- 300-7 400- 6- 150- 200-7 300- 100-850 200- 0123456789 0-7 X 100- 0 0 12 3 4 5 6 7 89 0123456789 200 400 600 Use technology to find the power equation. y = (]) x (Round to two decimal places as needed.)Describe the explained variation about a regression line in Iwords and in symbols. Choose the correct answer below. J" O A. The explained variation is the sum oi the squares of the dierences between the observed yvalues and the predicted vaalues. O B. The explained variation is the sum of the squares of the differences between the predicted yvalues and the mean of the y-values ot the ordered pairs. 0 C. The explained variation is the sum of the squares of the differences between the yvalues oi each ordered pair and the mean oi the yvalues of the ordered pairs. The explained variation in symbols can be desolibed by the expression Use the data shown in the table. Replace each xvalue and yvalue in the table w'th its logarithm. Find the equation of the regression line for the transformed data. Then construct a scatter plot of 1: log x, log y) and sketch the regression line with it. What do you notice? 1 1 2 3 4 5 6 Y B % y 675 25? 167 71 9? 79 65 44 Find the equation of the regression line of the transformed data. log 5r =| log 3: + (Round to three decimal places as needed.) Constmct a scatterplot of i log x, log y) with the values of log K on the horizontal axis and the values of logy on the vertical axis and sketch the regression line with it. Choose the correct graph below. DA. DE. QC. on. 12 84: a. IIIIII a. l a Q Q Q 1.6 '12 What do you notice? The graph to the right is a scatterplot of the untransformed data with the xvalues on the horizontal axis and a the 5walues on the vertical axis along with the resulting regression line. '0\" ex Alinear model is |::l appropriate for the transformed data than for the untransformed data. The following table shows the weights [in pounds) and the number of hours slept in a day by a random sample of intents. Test the claim that I'Il'la'E 0. Use a: 0.1. Then interpret the results in the context oi the problem. If convenient, use technology to solve the problem. 0 Click the icon to View more information about hypothesis testing or slope. % Identify the null and alternative hypotheses. OA. H02MU OB. HD:M2l] HA: M=U Hg: Meet] QC. HD:M=D OD. Hazl'utsl] HA: Matt] HA: Mail] Calculate the test statistic. FD (Round to three decimal places as needed.) Calculate the Pvalue P : (Round to four decimal places as needed.) State the conclusion. l: H\". There is lj evidence at the 10% level of signicance to support the claim that there is a linear relationship between weight and number of hours slept. The table shows the total square footage (in billions] of reta'ling space at shopping centers and their sales (in billions of dollars) for 11] years. The equation of the regression line is Q = 533.490): 2194.012. Complete parts a and b. 1323.3 1443.3 1534.6 (a) Find the coefcient of determination and interpret the result. D (Round to three decimal places as needed.) How can the coefcient of determination be interpreted? O A. The coefcient of determination is the fraction of the variation in sales that can be explained by the variation in total square footage. The remaining traction of the variation is unexplained and is due to other factors or to sampling error. 0 B. The coefficient of determination is the fraction of the variation in sales that is unexplained and is due to other factors or sampling error. The remaining traction of the variation is explained by the variation in total square footage. (b) Find the standard error of estimate se and interpret the result. D (Round the nal answer to three decimal places as needed. Round all intermediate values to four decimal places as needed.) HOW can the standard error ofestimate be interpreted? O A. The standard error of estimate of the sales for a specific total square footage is about 5.: billion dollars. 0 B. The standard error of estimate of the total square footage for a specic number of sales is about 52 billion dollars. The maximum weights (in kilograms} for which one repetition of a halt squat can be performed and the times [in seconds] to run a 10meter splint tor 12 international soccer players are shown in the attached data table with a sample correlation coefcient r of D.969.A13th data point was added to the end of the data set for an international soccer player who can perform the hatf squat with a maximum ot2i15 kilograms and can sprint ti] meters in 2.01 seconds. Describe how this affects the correlation coefcient r. Use technology. Click the icon to View the data set. ..... ) The new correlation coeicient r 7 going from 0.959 to D. (Round to three decimal places as needed.) The maximum weights [in kilograms] for which one repetition of a half-squat can be performed and thejump heights {in centimeters) for 12 intemational soccer players are given in the accompanying table. The correlation coetcient. rounded to three decimal places, is r= 0.784. At a = 0.05, is there enough evidence to conclude that there is a signicant linear correlation between the variables? Click the icon to View the soccer player data. Determine the null and alternative hypotheses. Hu:p U Ha:p 0 Determine the critical value [s]. 10: (Round to three decimal places as needed. Use a comma to separate answers as needed.) Determine the standardized test statistic. t= :| (Round to three decimal places as needed} What is the conclusion? : HI]. There E enough evidence at the 5% level of signicance to conclude that there is a signicant linear conelation between the maximum weight for one repetition of a half squat and thejump height

Step by Step Solution

There are 3 Steps involved in it

Step: 1

blur-text-image

Get Instant Access to Expert-Tailored Solutions

See step-by-step solutions with expert insights and AI powered tools for academic success

Step: 2

blur-text-image

Step: 3

blur-text-image

Ace Your Homework with AI

Get the answers you need in no time with our AI-driven, step-by-step assistance

Get Started

Recommended Textbook for

Algebra Foundations Prealgebra, Algebra & Intermediate Algebra (subscription)

Authors: Elayn Martin Gay

2nd Edition

0135257506, 9780135257500

More Books

Students also viewed these Mathematics questions

Question

How do childhood experiences affect self-esteem?

Answered: 1 week ago

Question

The quality of the proposed ideas

Answered: 1 week ago

Question

The number of new ideas that emerge

Answered: 1 week ago