

Answered step by step
Verified Expert Solution
Question
1 Approved Answer
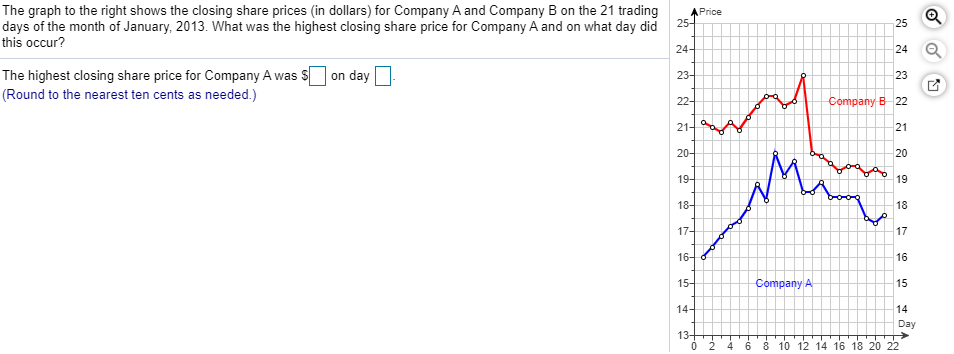
A Price The graph to the right shows the closing share prices in dollars) for Company A and Company B on the 21 trading days
Step by Step Solution
There are 3 Steps involved in it
Step: 1

Get Instant Access to Expert-Tailored Solutions
See step-by-step solutions with expert insights and AI powered tools for academic success
Step: 2

Step: 3
Ace Your Homework with AI
Get the answers you need in no time with our AI-driven, step-by-step assistance
Get Started
Fundamentals of Investment Management
Authors: Geoffrey Hirt, Stanley Block
10th edition
0078034620, 978-0078034626