A psychologist has been studying delayed recall of certain words using a new memory measure.On this measure, she has found that the distribution follows a normal curve.The memory test has a mean of 15words recalled and a standard deviation of 2.5.Using a normal curve table, what score on the memory measure would a person need to have to be in the top 15%?
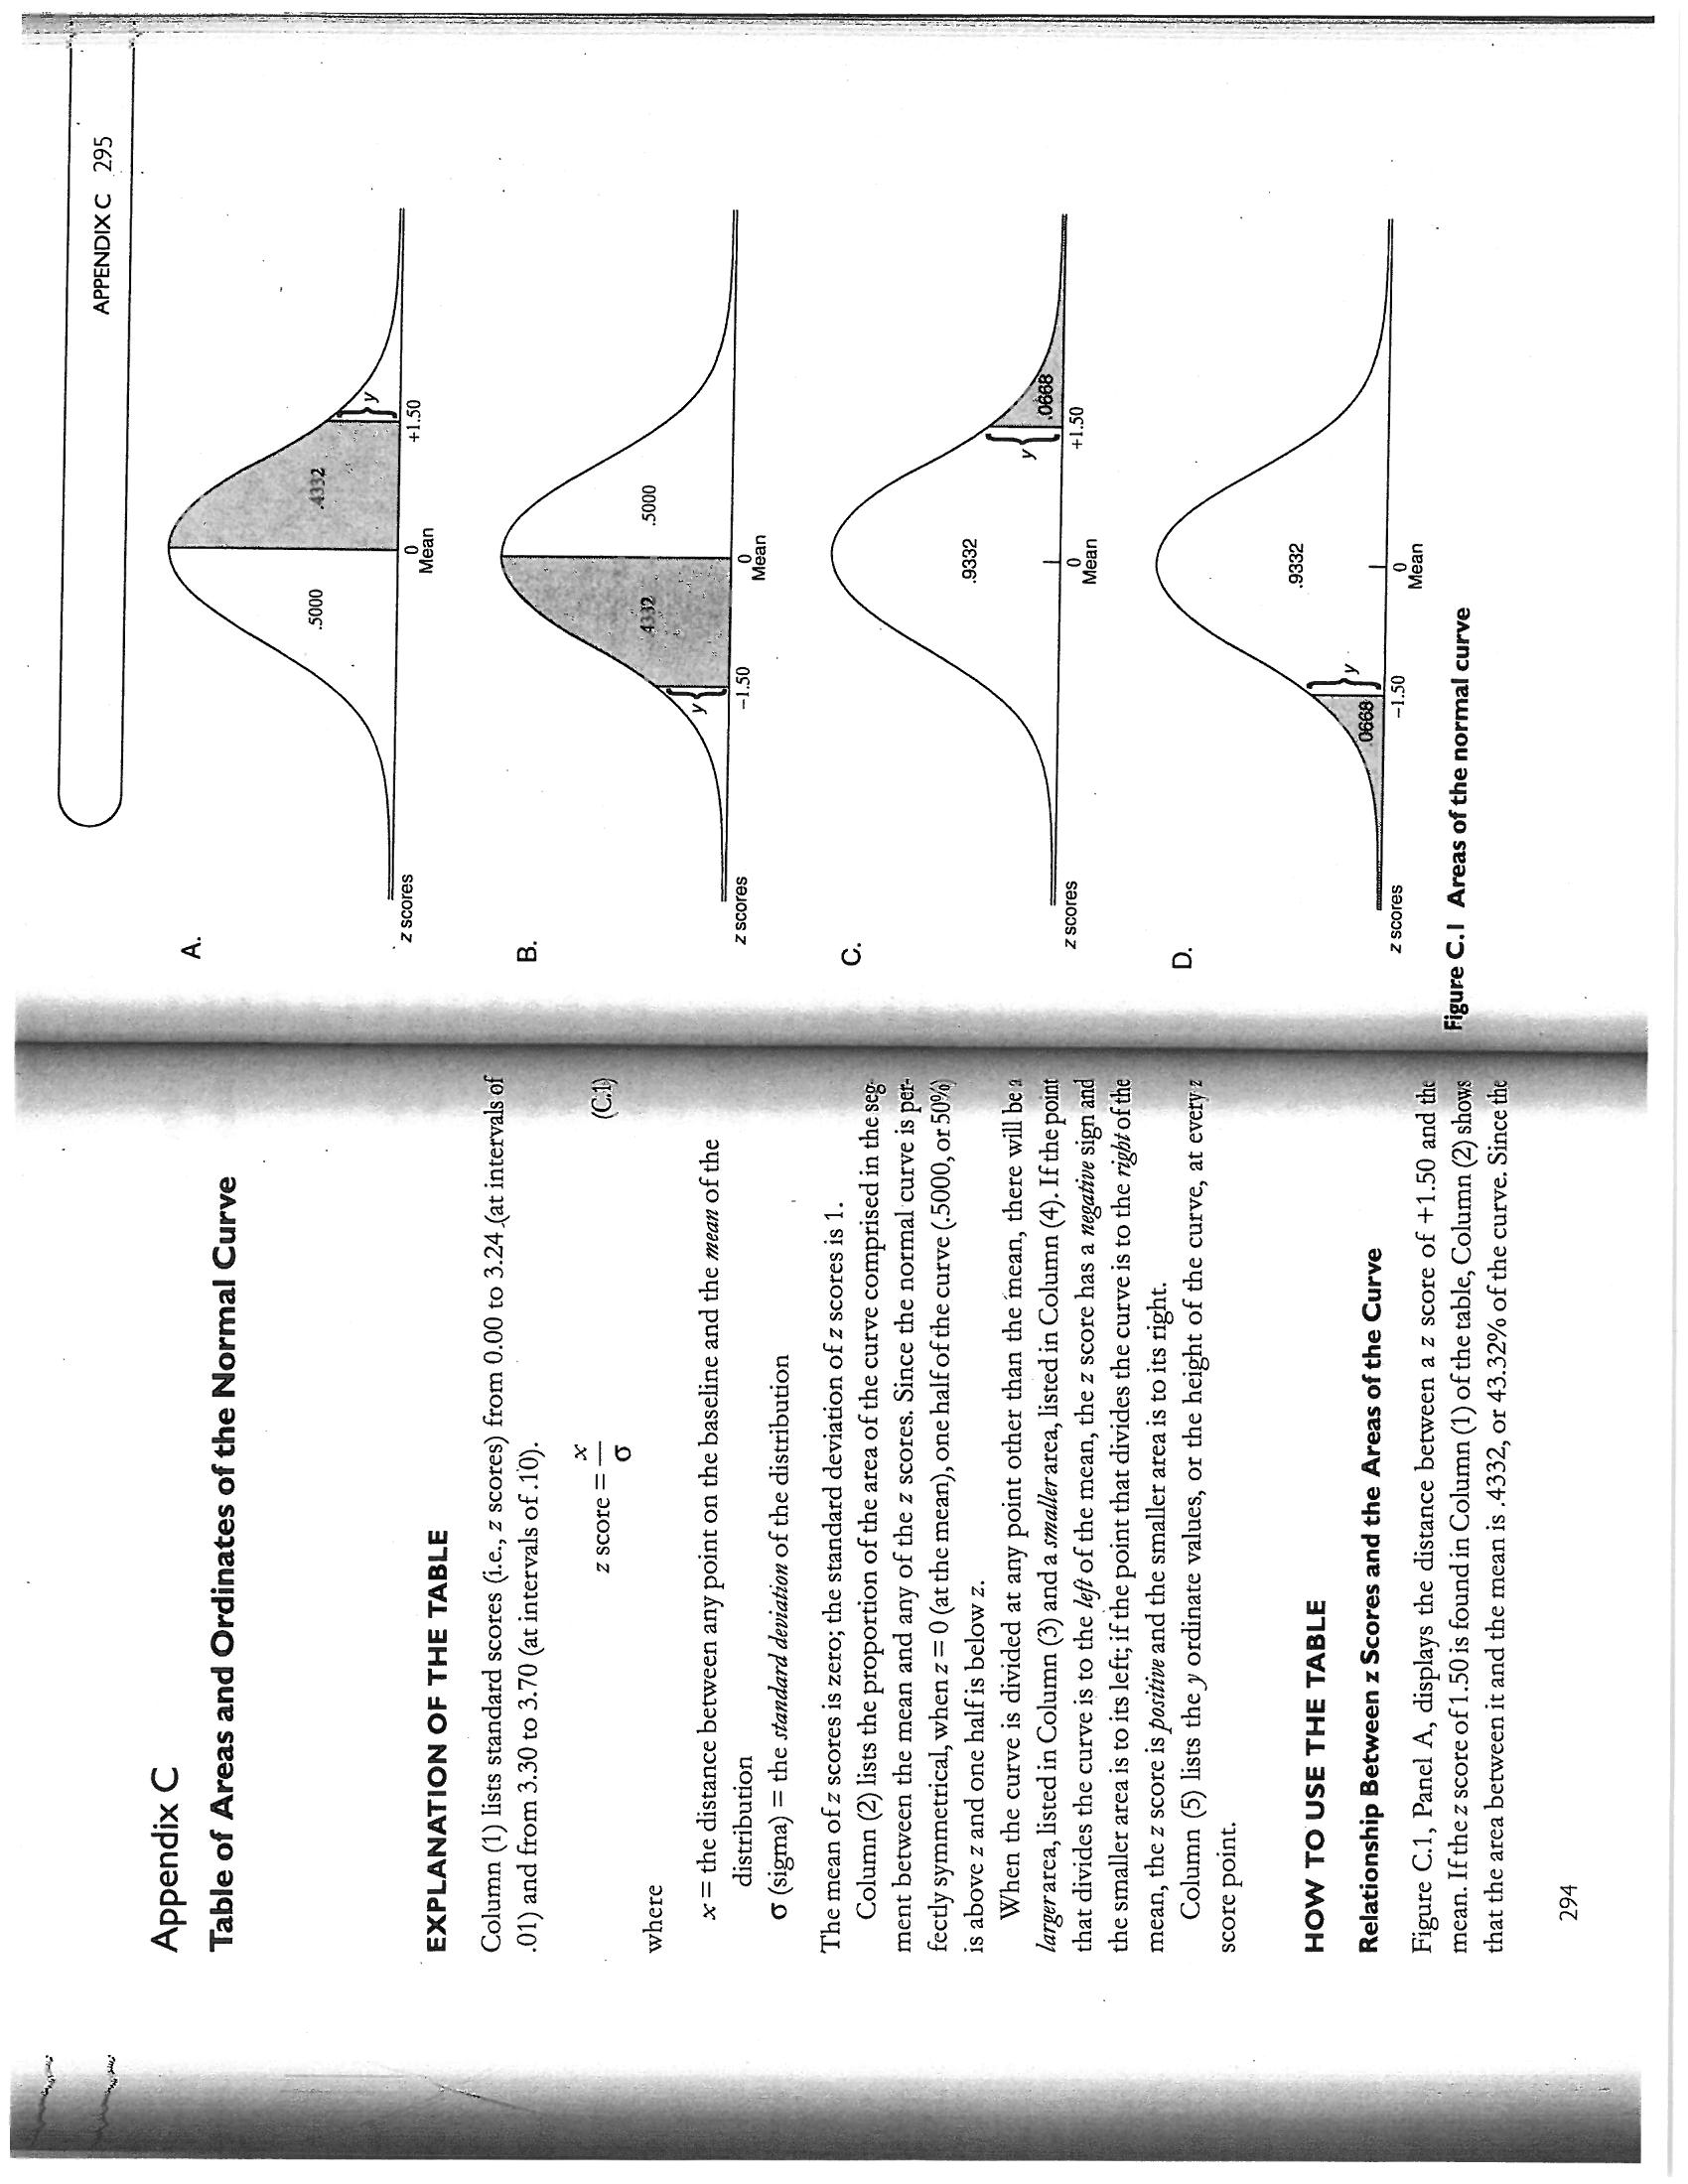
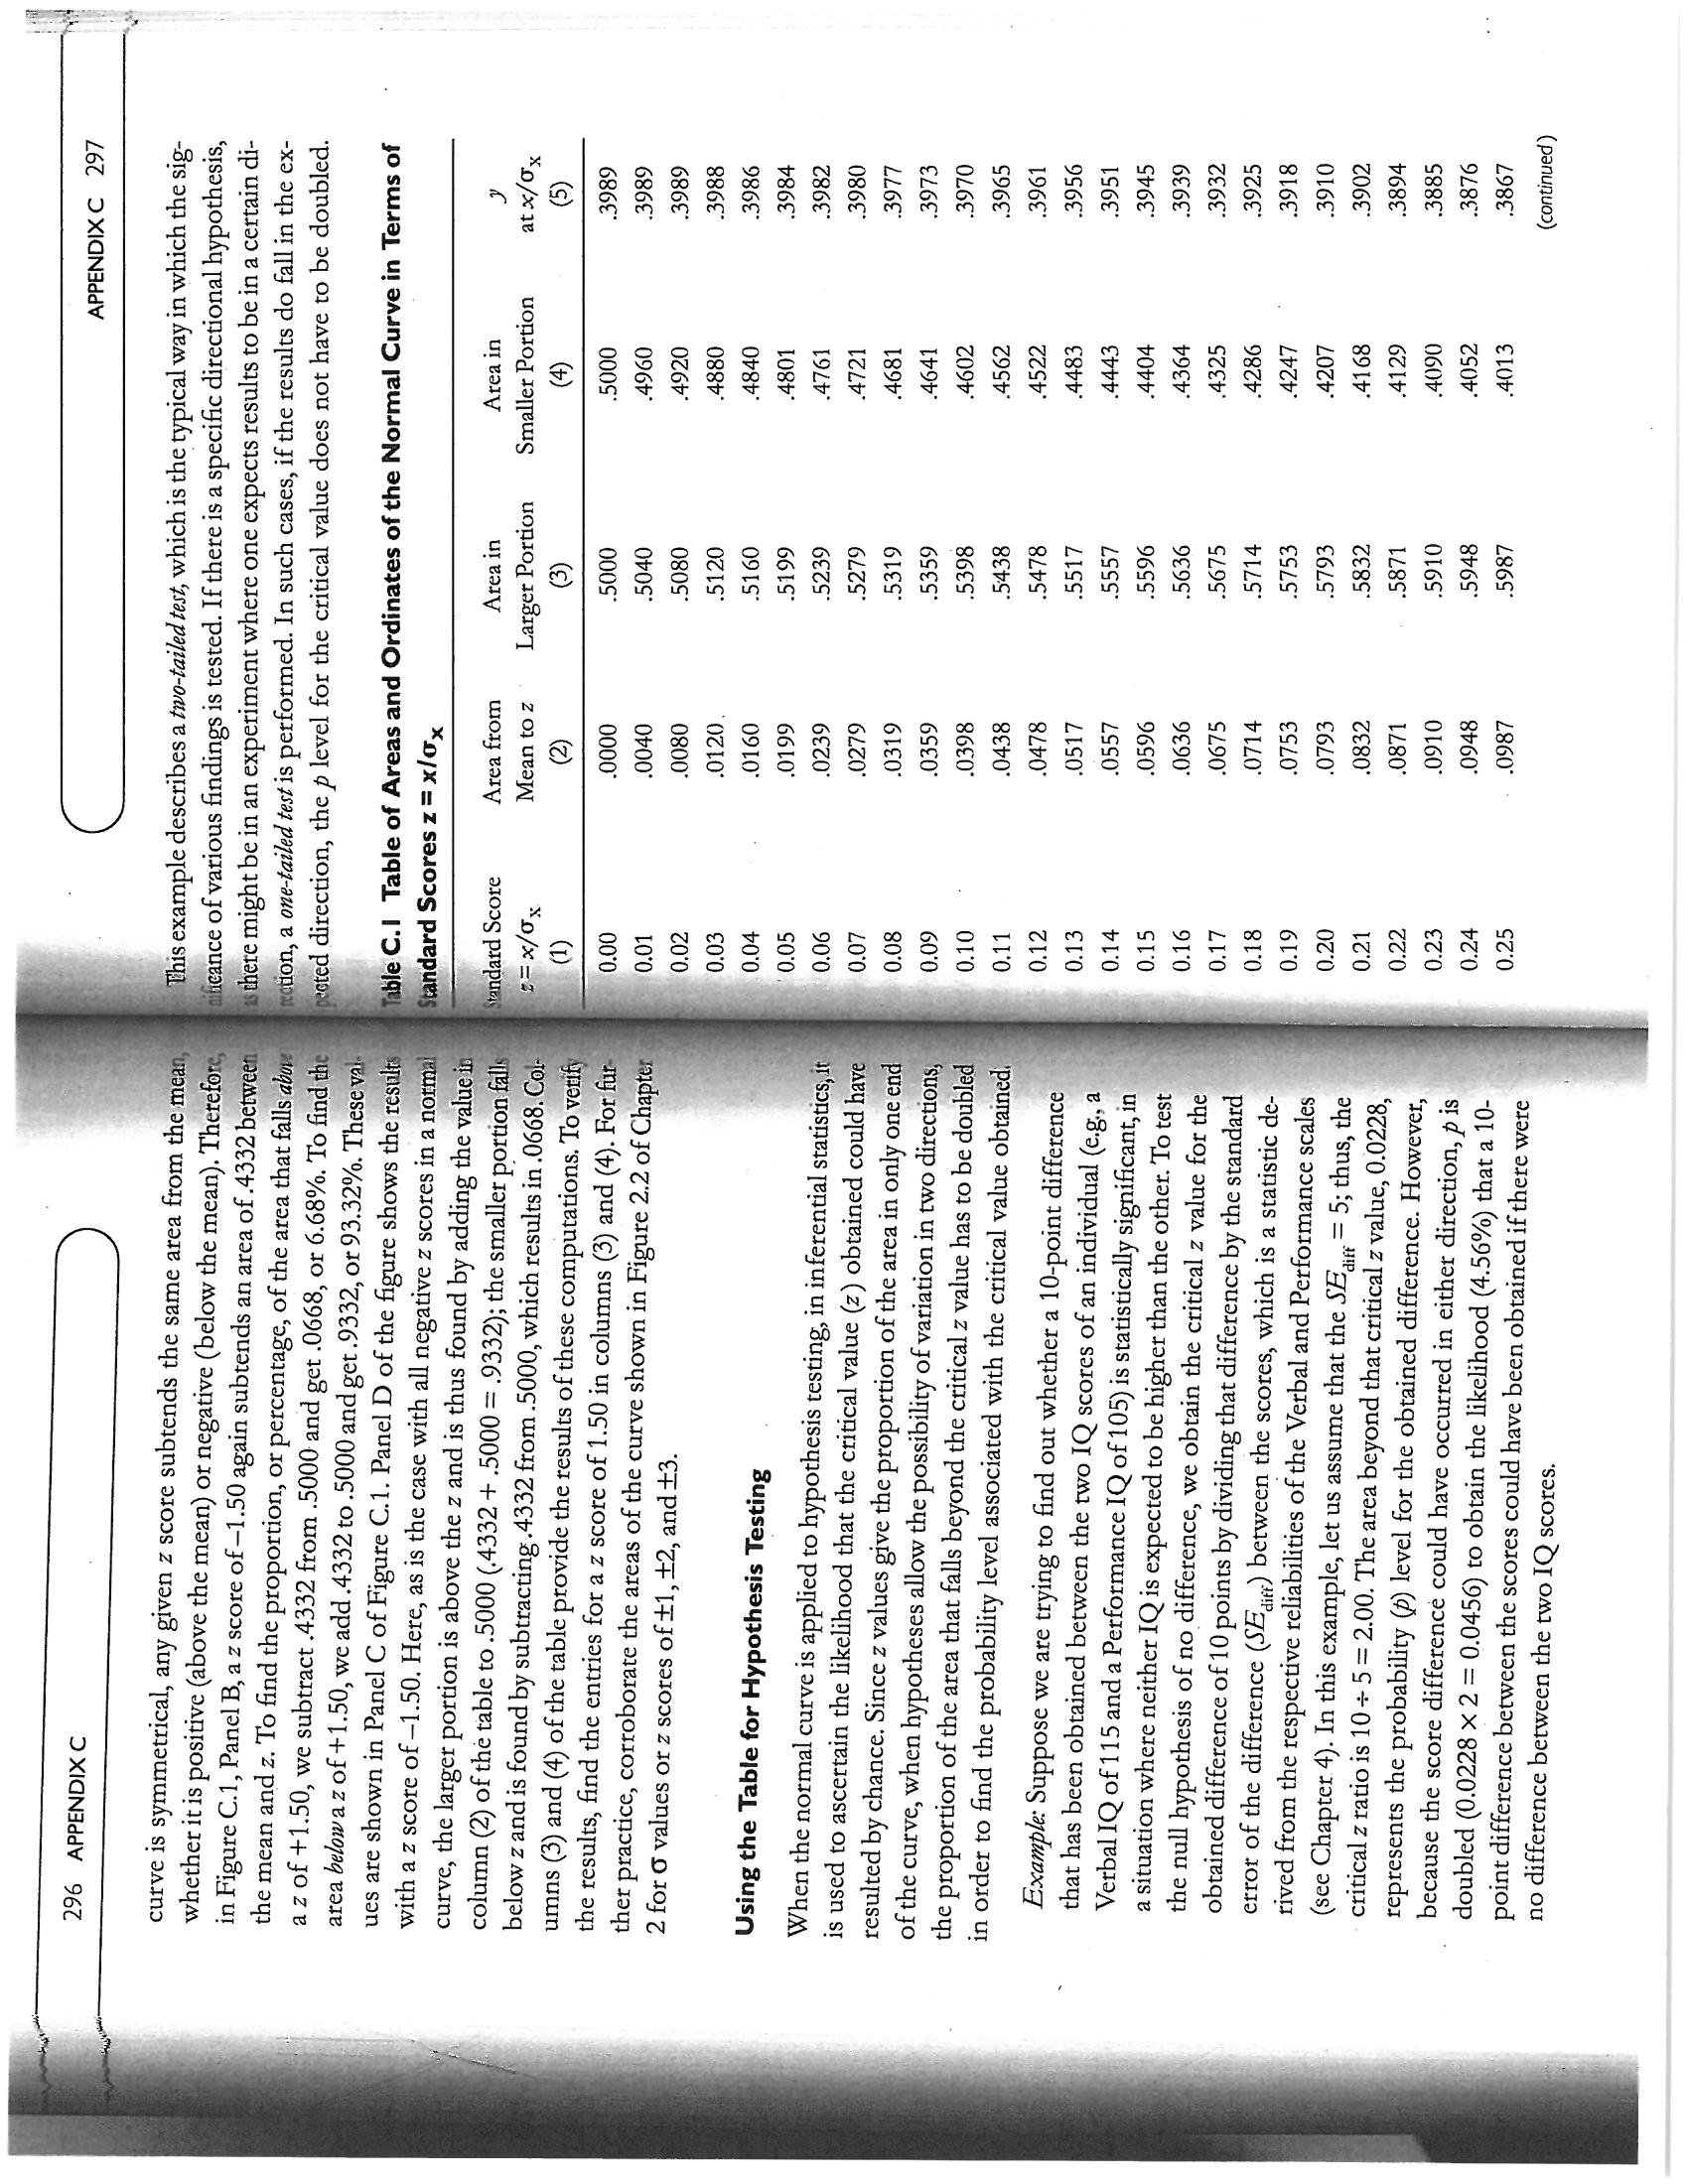
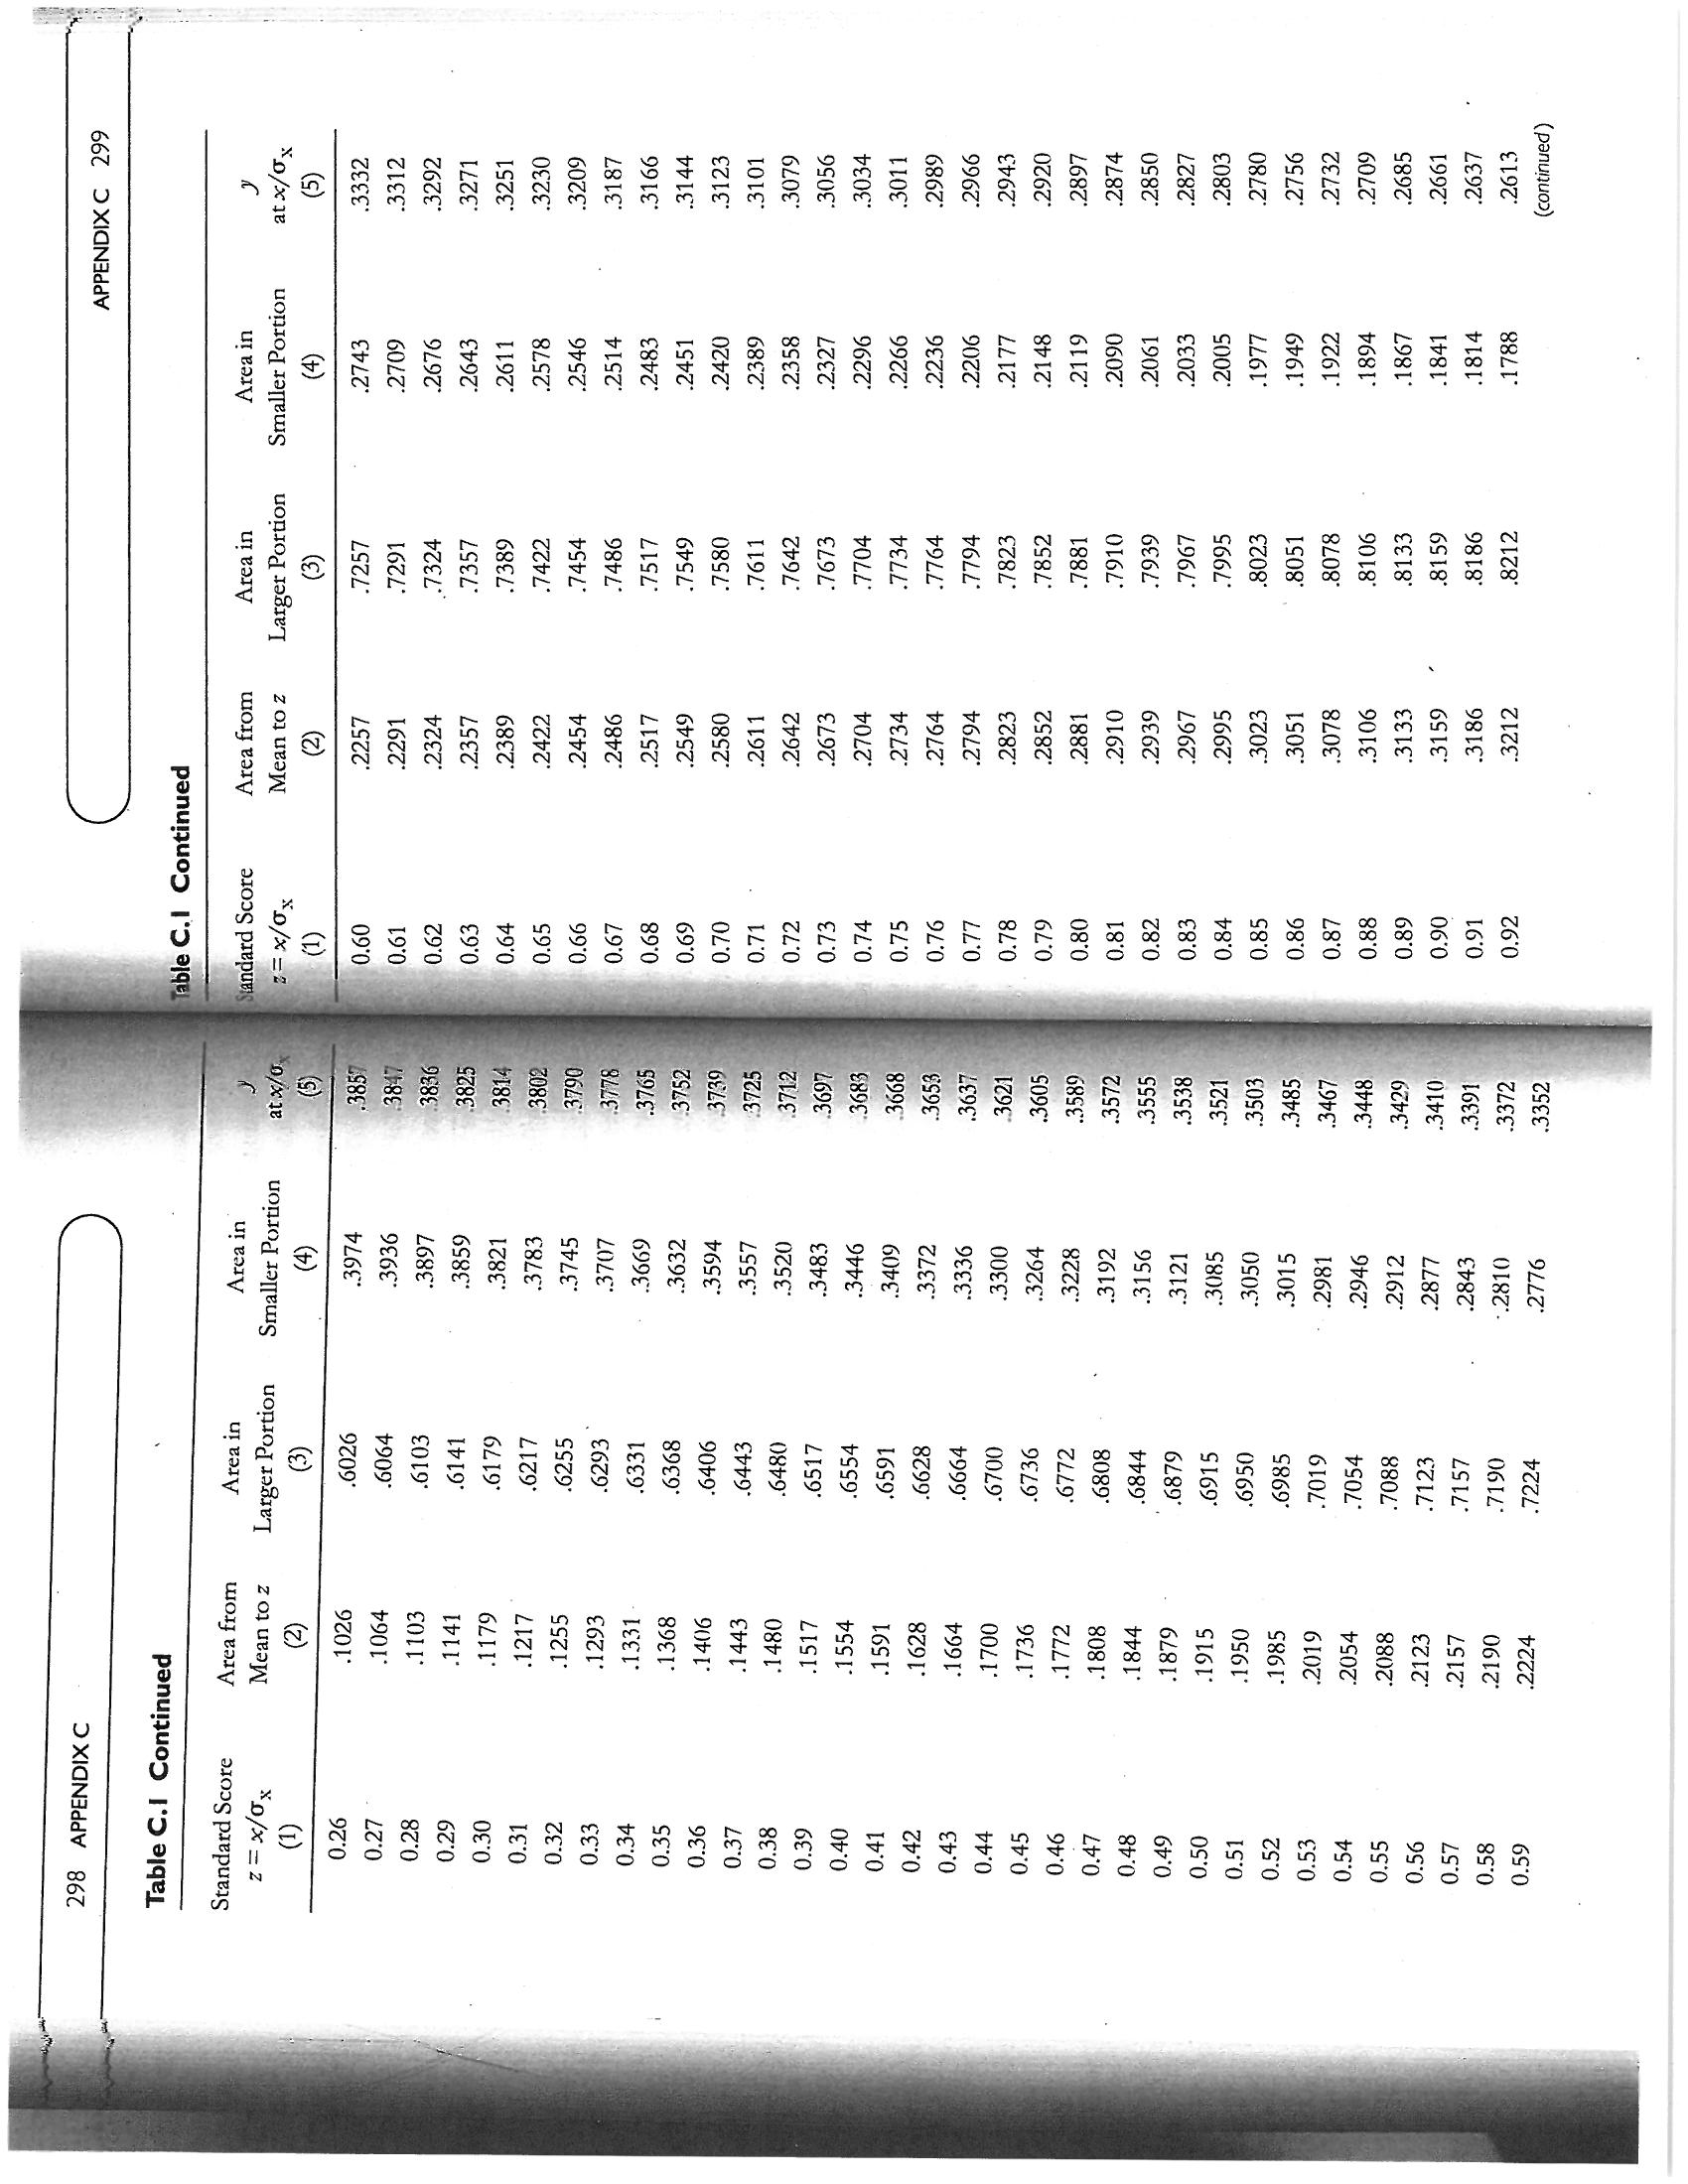
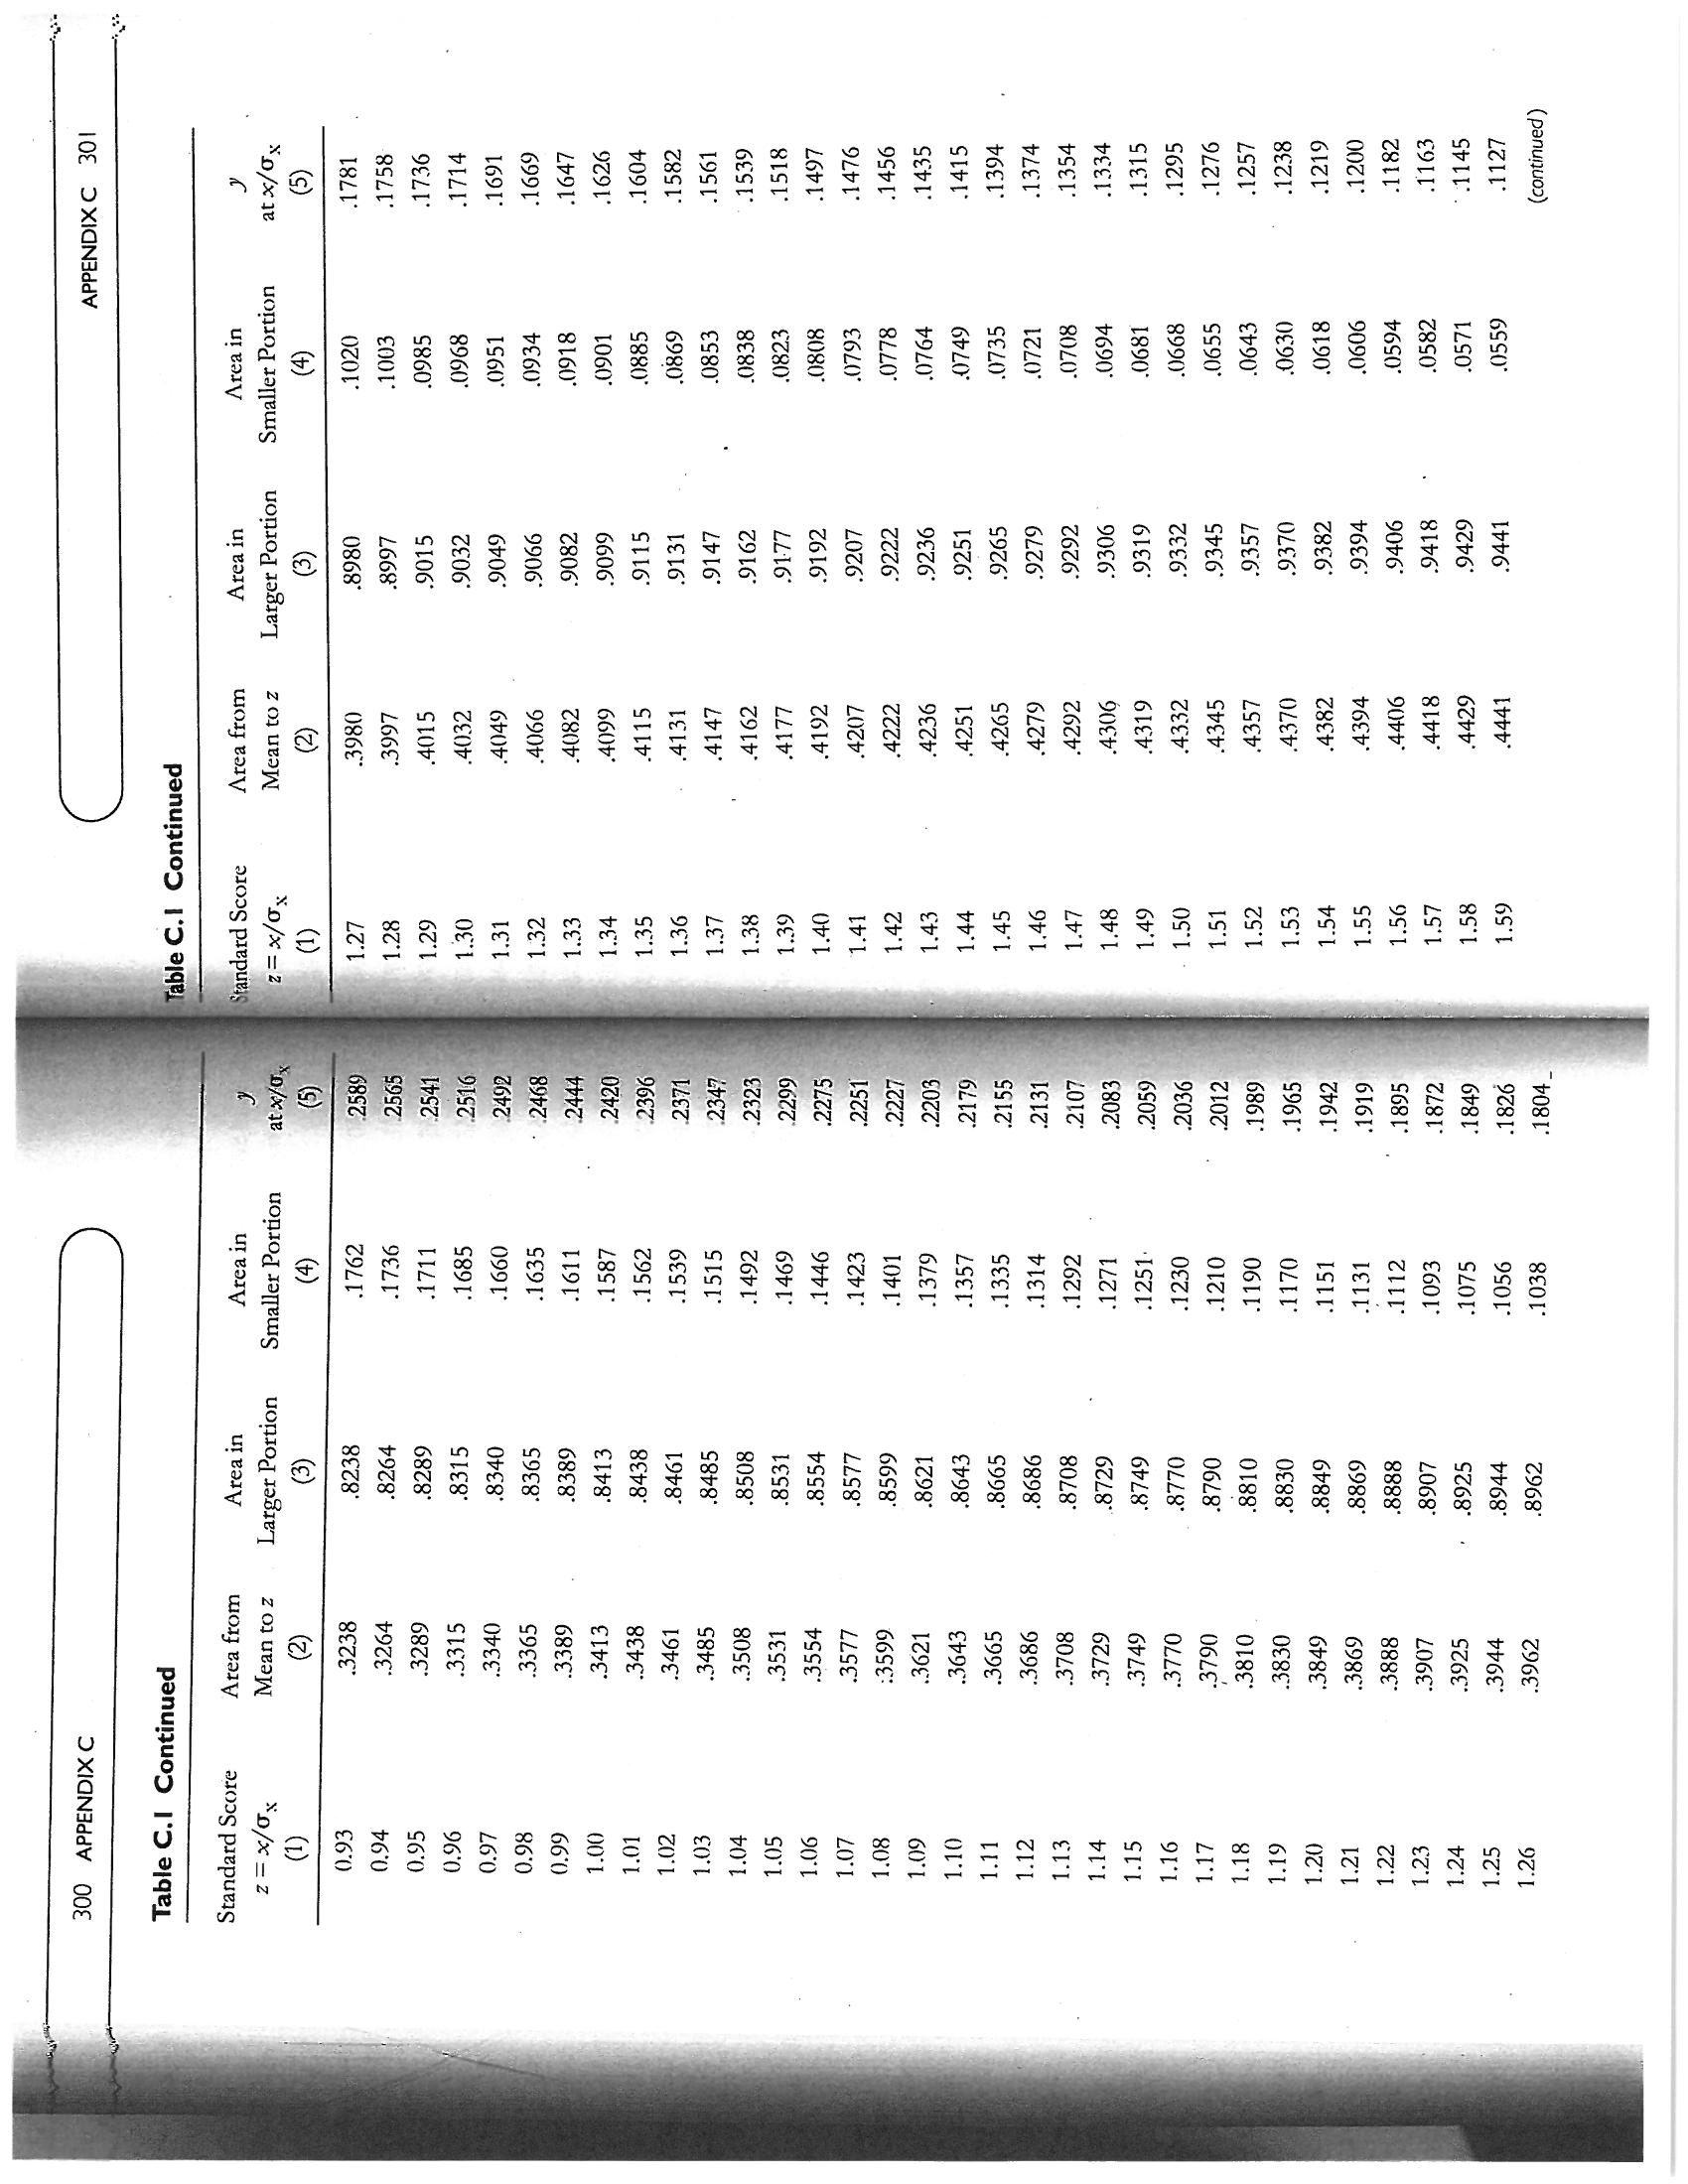
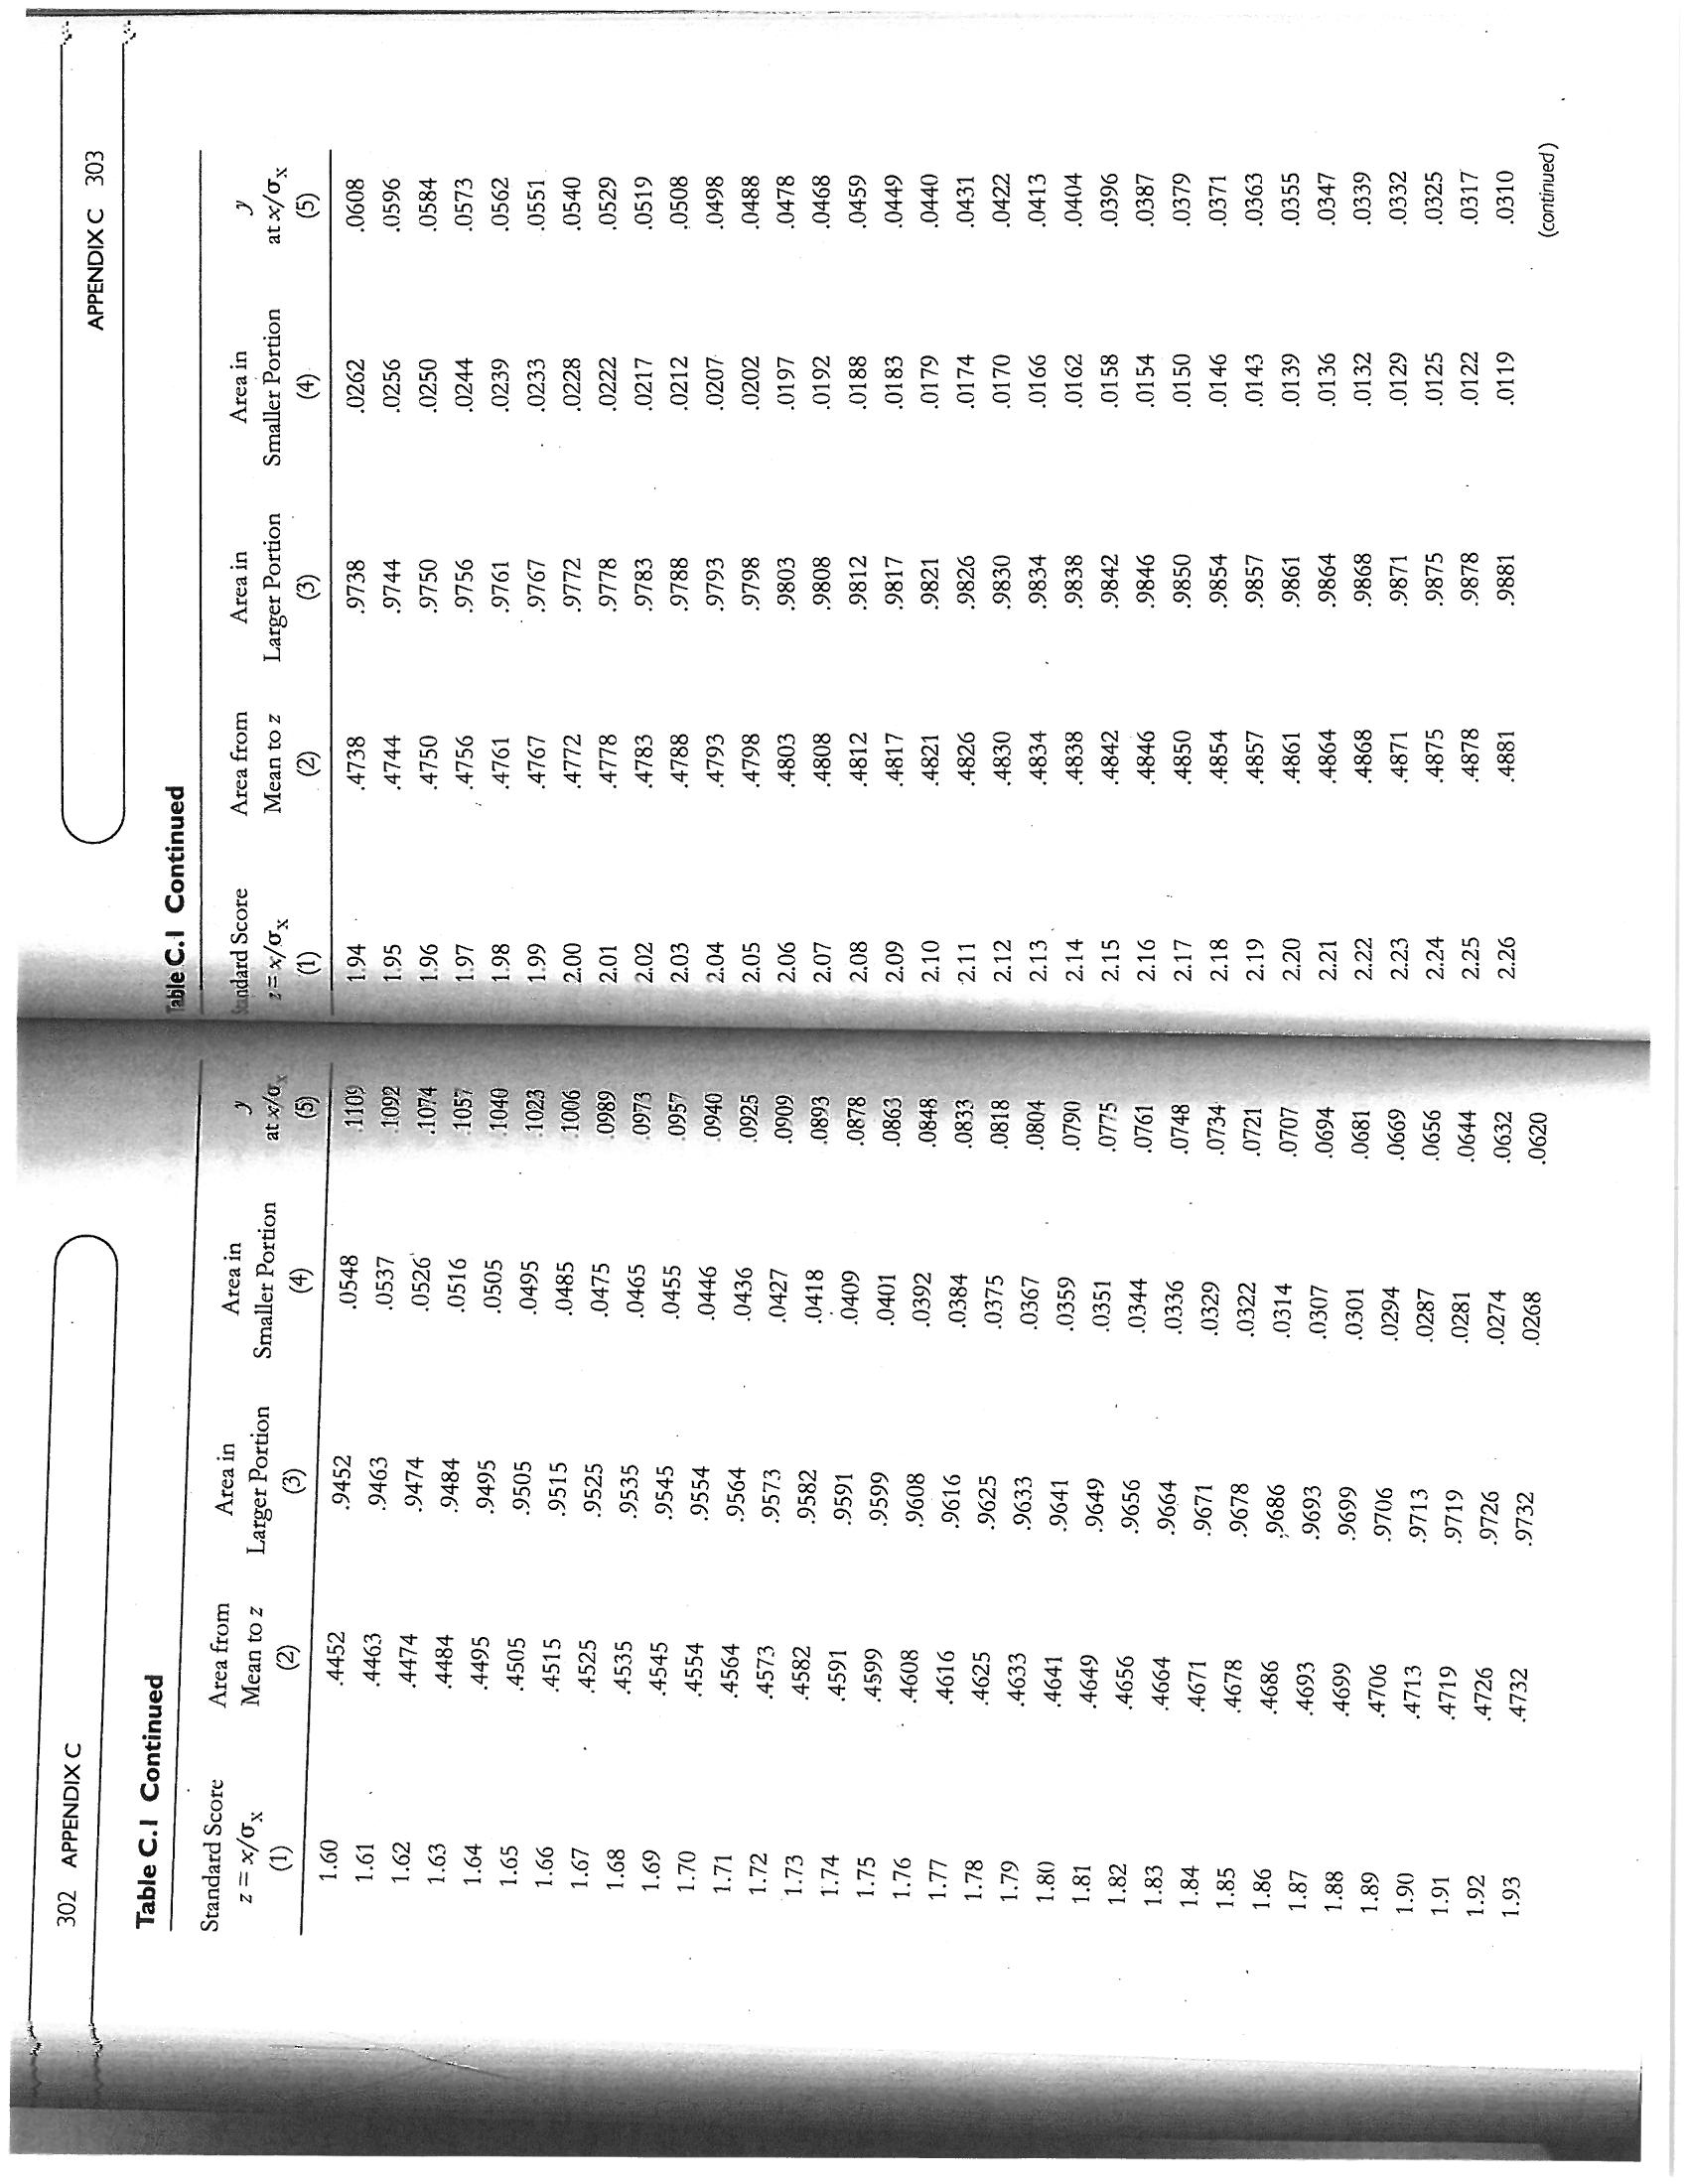
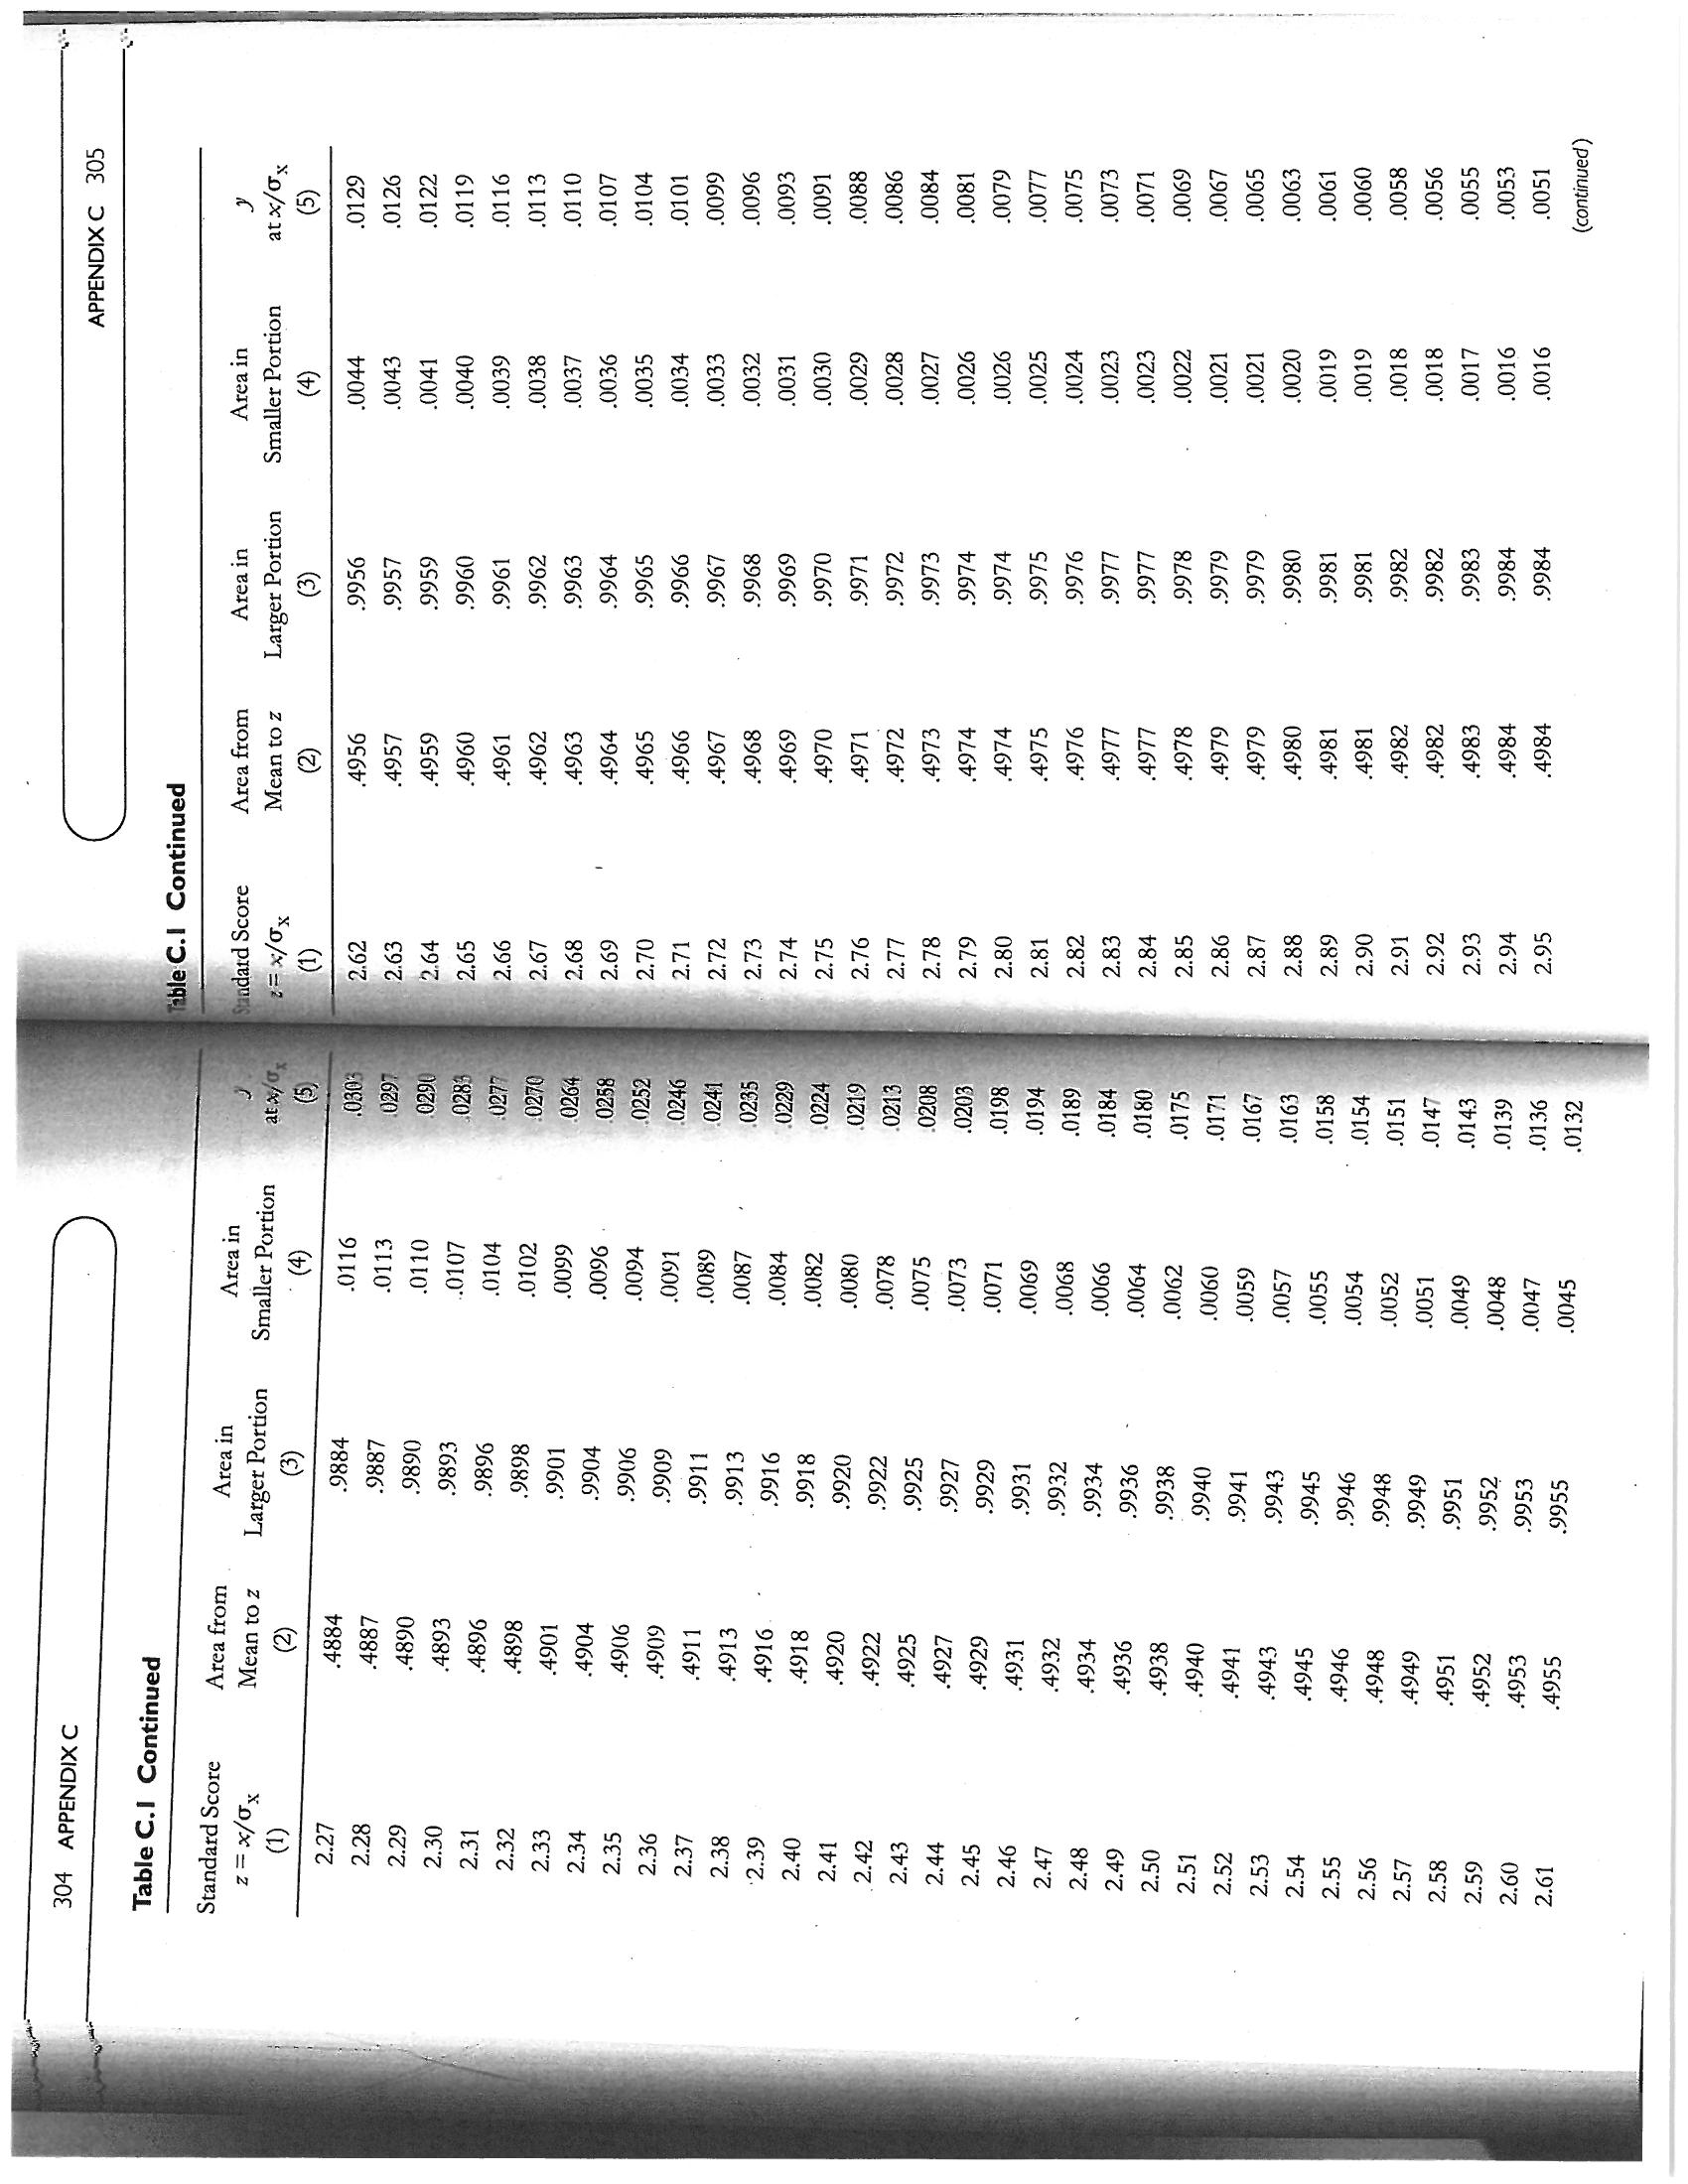
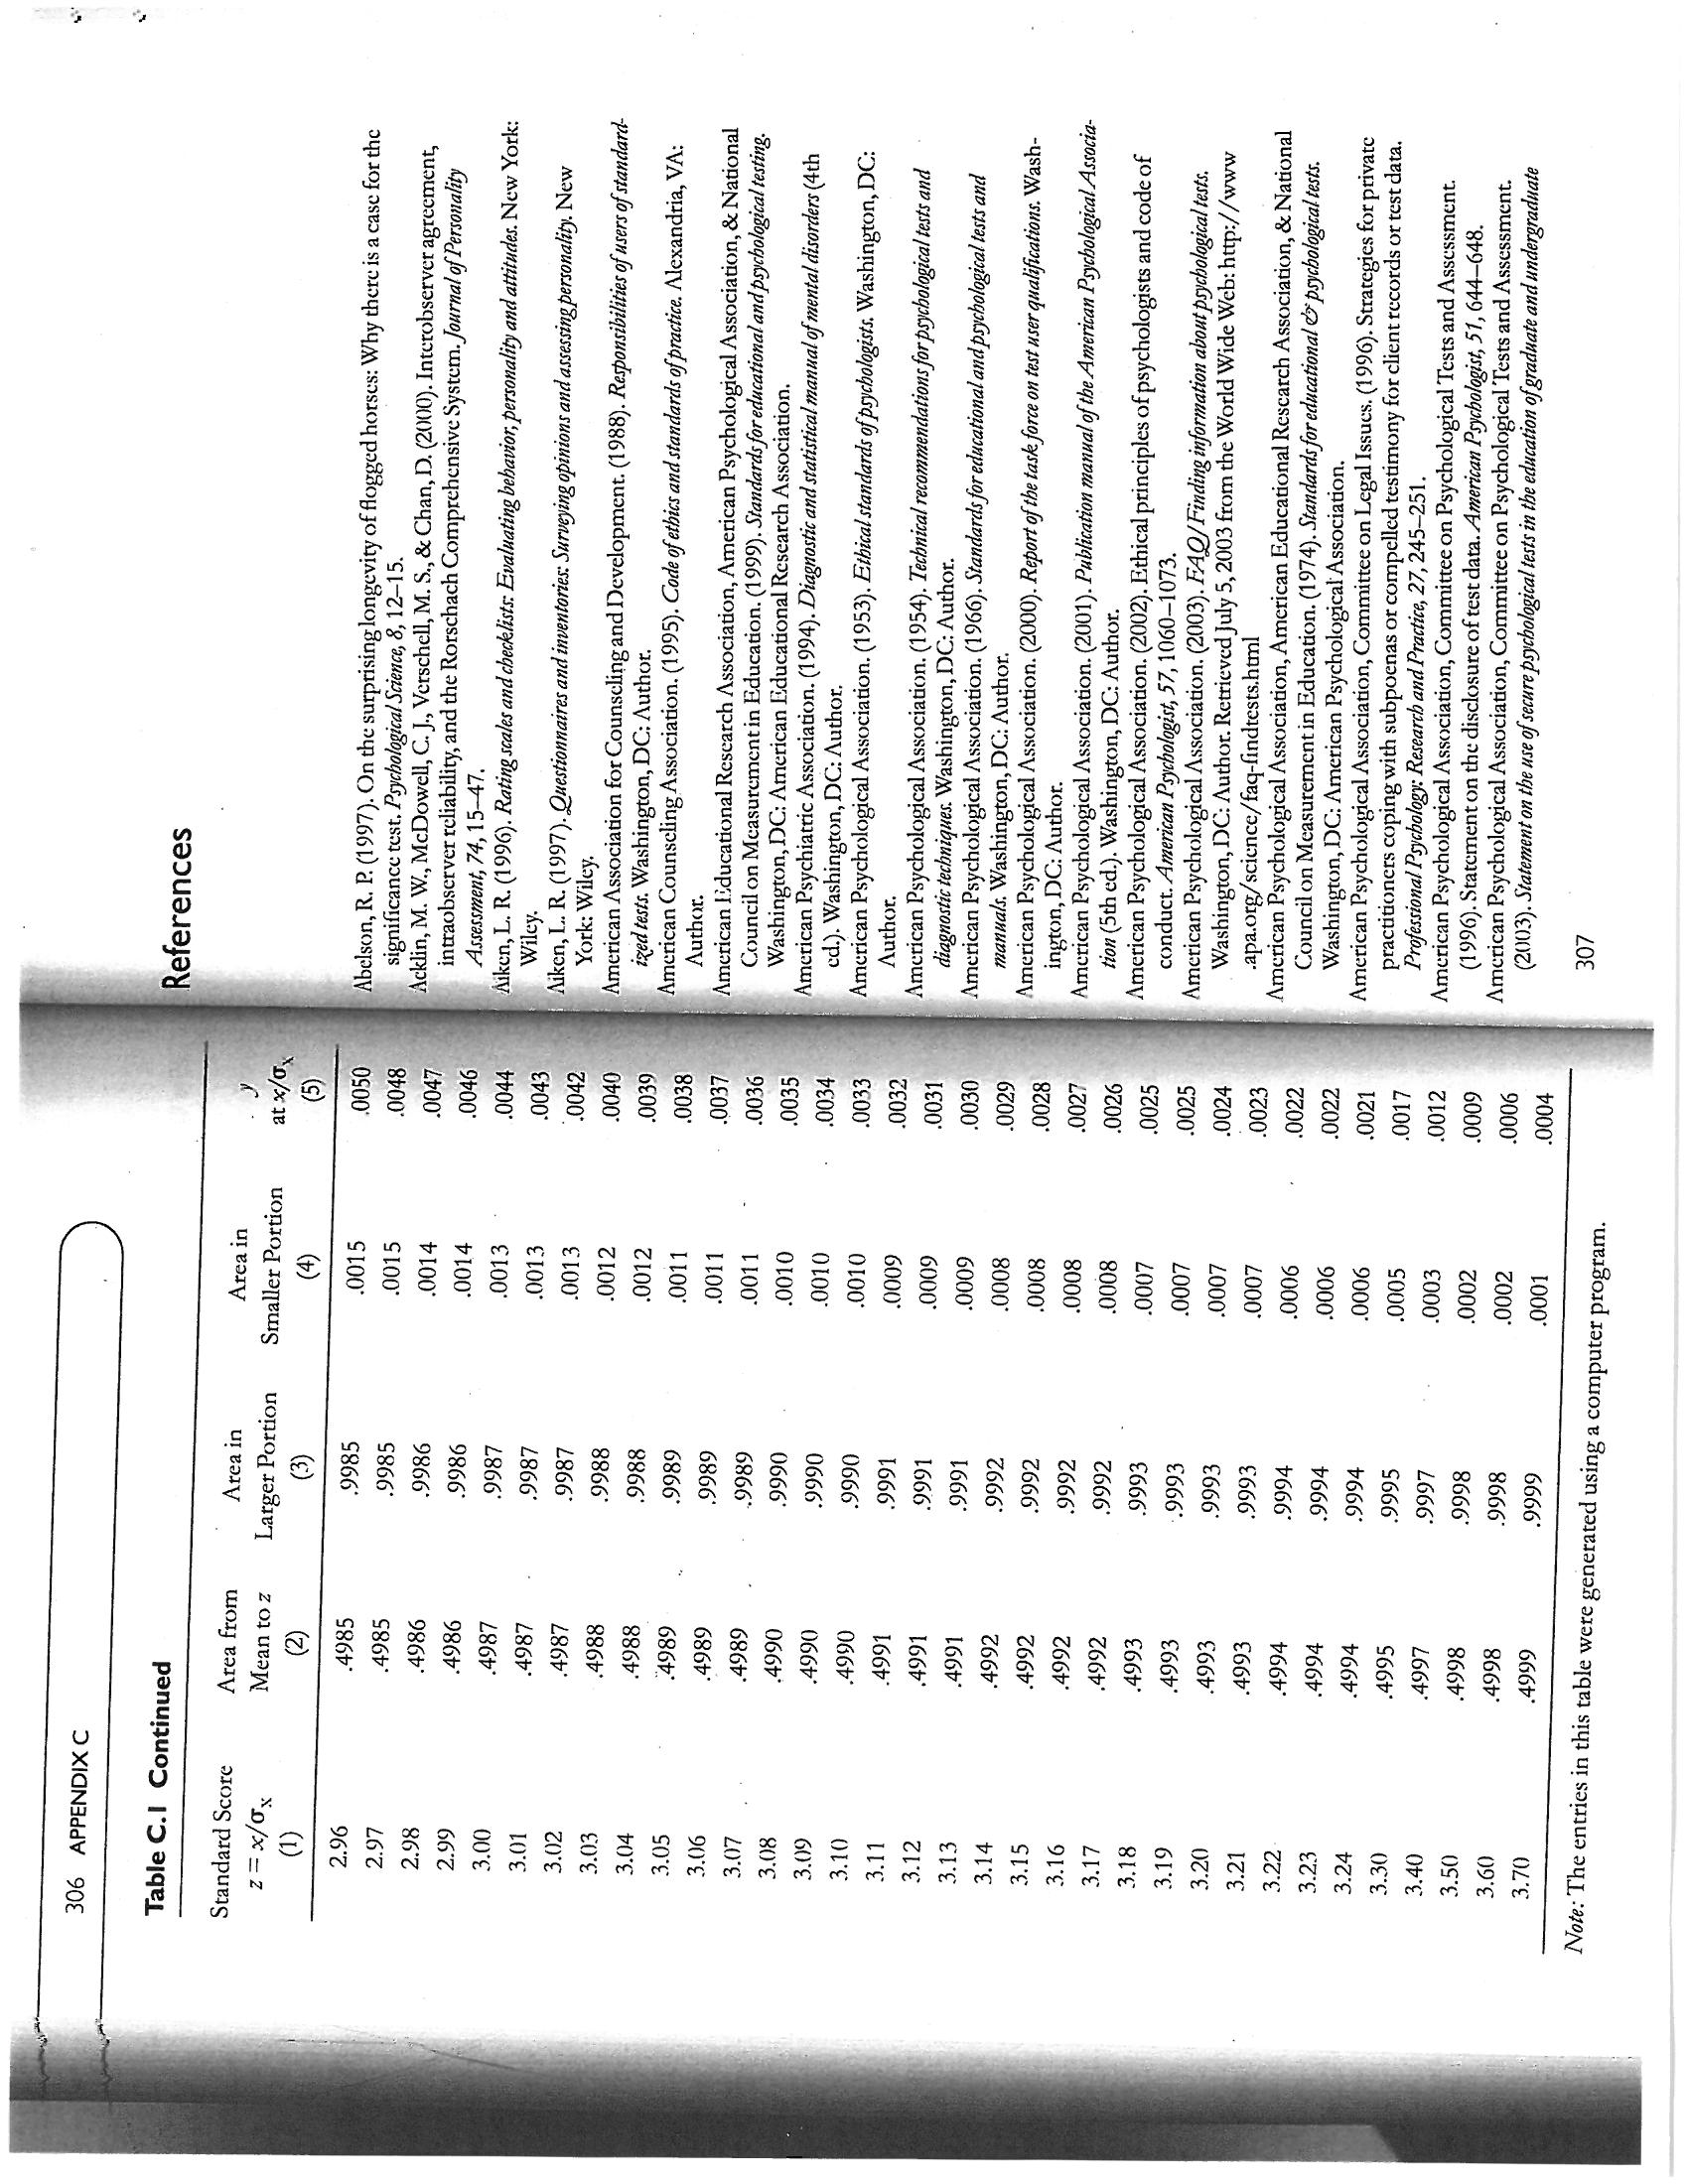
APPENDIX C 295 .0668 +1.50 +1.50 .4332 .5000 Mean Mean 9332 Mean .9332 Mean .5000 4332 -1.50 -1.50 0668J Figure C. I Areas of the normal curve z scores z scores z scores z scores O x | b Column (2) lists the proportion of the area of the curve comprised in the seg Column (5) lists the y ordinate values, or the height of the curve, at every z When the curve is divided at any point other than the mean, there will be a Column (1) lists standard scores (i.e., z scores) from 0.00 to 3.24 (at intervals of ment between the mean and any of the z scores. Since the normal curve is per- that divides the curve is to the left of the mean, the z score has a negative sign and mean. If the z score of 1.50 is found in Column (1) of the table, Column (2) shows fectly symmetrical, when z = 0 (at the mean), one half of the curve (.5000, or 50%) larger area, listed in Column (3) and a smaller area, listed in Column (4). If the point that the area between it and the mean is .4332, or 43.32% of the curve. Since the the smaller area is to its left; if the point that divides the curve is to the right of the Figure C.1, Panel A, displays the distance between a z score of +1.50 and the z score = x = the distance between any point on the baseline and the mean of the Table of Areas and Ordinates of the Normal Curve The mean of z scores is zero; the standard deviation of z scores is 1. Relationship Between z Scores and the Areas of the Curve mean, the z score is positive and the smaller area is to its right. (sigma) = the standard deviation of the distribution .01) and from 3.30 to 3.70 (at intervals of . 10) EXPLANATION OF THE TABLE is above z and one half is below z. HOW TO USE THE TABLE distribution Appendix C score point. 294 where(continued) 3885 .3910 .3925 .3945 .3951 .3894 3988 3980 3973 .3918 3986 3984 3932 .3902 .3977 .3956 .3939 .3867 .3961 .387 at x/ Ox .3982 .397 .3965 .3989 .3989 .3989 APPENDIX C 297 .4247 .4364 .4052 4681 .4286 .4207 .4090 .4602 .4168 .4129 .4013 4761 .4562 .4325 .4522 .4483 .4404 .4721 .4443 5000 .4880 4801 .4840 4960 .4641 .4920 Area in Smaller Portion This example describes a two-tailed test, which is the typical way in which the sig- 5832 5987 5398 .5948 5753 is there might be in an experiment where one expects results to be in a certain di- .531 .5359 .5478 .5910 .5517 .5596 .5714 .5636 .5675 .5871 .5557 aificance of various findings is tested. If there is a specific directional hypothesis, .5793 .5080 .5040 .5239 .5279 .5438 rection, a one-tailed test is performed. In such cases, if the results do fall in the ex- .5160 .5199 .5120 C pected direction, the p level for the critical value does not have to be doubled Area in .5000 Table C.I Table of Areas and Ordinates of the Normal Curve in Terms of Larger Portion .0948 .0910 .0675 .0714 .0987 .0871 .0080 .0199 .0239 .0279 Mean to z .0319 .0359 .0398 .0478 .0517 .0557 .0753 .0793 Area from .0040 .0832 .0120 .0000 .0160 Standard Scores z = x/ox Standard Score 2= x/0x 0.24 0.22 0.20 0.23 0.08 0.09 0.21 0.25 0.12 0.13 0.14 0.16 0.17 e 0.07 0.15 0.18 0.00 0.06 0.10 0.11 0.19 0.02 0.0 0.0 0.0 0.0 the mean and z. To find the proportion, or percentage, of the area that falls above whether it is positive (above the mean) or negative (below the mean). Therefore, curve is symmetrical, any given z score subtends the same area from the mean, in Figure C.1, Panel B, a z score of -1.50 again subtends an area of .4332 between a z of +1.50, we subtract .4332 from .5000 and get .0668, or 6.68%. To find the area below a z of +1.50, we add .4332 to . 5000 and get . 9332, or 93.32%. These val- ues are shown in Panel C of Figure C.1. Panel D of the figure shows the results with a z score of -1.50. Here, as is the case with all negative z scores in a normal column (2) of the table to .5000 (.4332 + .5000 =.9332); the smaller portion falls curve, the larger portion is above the z and is thus found by adding the value in below z and is found by subtracting . 4332 from .5000, which results in .0668. Col- umns (3) and (4) of the table provide the results of these computations. To verify the results, find the entries for a z score of 1.50 in columns (3) and (4). For fur ther practice, corroborate the areas of the curve shown in Figure 2.2 of Chapter Example: Suppose we are trying to find out whether a 10-point difference When the normal curve is applied to hypothesis testing, in inferential statistics, it is used to ascertain the likelihood that the critical value (z) obtained could have that has been obtained between the two IQ scores of an individual (e.g., a resulted by chance. Since z values give the proportion of the area in only one end Verbal IQ of 115 and a Performance IQ of 105) is statistically significant, in the null hypothesis of no difference, we obtain the critical z value for the of the curve, when hypotheses allow the possibility of variation in two directions, the proportion of the area that falls beyond the critical z value has to be doubled a situation where neither IQ is expected to be higher than the other. To test obtained difference of 10 points by dividing that difference by the standard error of the difference (SEdiff) between the scores, which is a statistic de- rived from the respective reliabilities of the Verbal and Performance scales (see Chapter 4). In this example, let us assume that the SEdiff = 5; thus, the in order to find the probability level associated with the critical value obtained critical z ratio is 10 + 5 = 2.00. The area beyond that critical z value, 0.0228 represents the probability (p) level for the obtained difference. However, because the score difference could have occurred in either direction, p is doubled (0.0228 x 2 = 0.0456) to obtain the likelihood (4.56%) that a 10- point difference between the scores could have been obtained if there were no difference between the two IQ scores. 2 for O values or z scores of +1, +2, and +3 Using the Table for Hypothesis Testing 296 APPENDIX C(continued) 2637 .2780 .2756 .2613 .2732 .2709 3056 .2966 3166 .2661 3312 .2897 .2850 .2943 .3144 .3034 at x/0x .3187 .3209 .3292 .3332 .3079 .3230 .310 .3271 .3251 APPENDIX C 299 1788 1814 1841 2005 2266 .2296 .1977 .1949 .2236 .2206 .2090 .2514 .2546 .2119 .2061 .203.3 .2578 .2177 .2148 Area in .2743 .2483 .2451 .2420 Smaller Portion .2676 .2643 .2611 8106 7852 7995 7794 7823 .8212 .8078 .8133 .8159 .8186 .7967 .7881 .7939 .8051 .7486 .7580 .7611 .7549 ..7324 .791 Area in 7291 .7357 .7704 7257 .7673 .7642 .7517 Larger Portion .7454 3078 2852 3106 .2823 .3212 .3186 .2734 .3133 .3159 .2910 .2794 .2642 .3051 .2967 .2995 .3023 .2454 .2673 .2704 .2939 .2422 .2389 .2357 .2324 Area from 2291 .2881 .2549 .2517 Mean to z Table C.I Continued Standard Score z = x/0 E 0.92 0.84 0.88 0.90 0.86 0.82 0.81 0.87 0.83 0.79 0.85 0.78 0.76 0.77 0.72 0.70 0.73 0.74 0.75 0.64 0.68 0.66 0.71 0.69 0.60 0.63 0.62 0.67 0.6 at x/0 3802 .3857 3790 .3778 3765 3752 3739 .3712 3725 3697 3825 3683 3668 .3653 .3621 .3605 .3589 .3572 .3555 .3538 .3521 .3503 .3429 .3410 .3467 3352 3372 .3391 Area in 3974 3936 Smaller Portion 3859 3594 .3821 .3897 .3557 .3446 .370 .3632 .366 .3409 .3372 .3336 3264 .3483 .3228 .3050 .3085 .3121 .3015 .2946 .2877 .2843 ..2810 .2776 Larger Portion Area in .6103 6255 .6141 .6217 .6293 6368 6406 6443 6480 .6331 .6554 .6517 .6664 .6591 .6628 6772 6808 6736 6879 .6950 .6915 .6985 .684 .7054 .7088 7123 7157 7190 .7019 Area from .1026 Mean to z 1141 .1103 .1064 .1217 1255 .13.31 1628 .1480 1736 .1591 1808 .1700 .1664 .2054 .184 .2123 .2088 .1879 .2019 .2157 2224 Table C.I Continued Standard Score 0.26 z = x/0 0.27 0.29 0.30 0.31 0.35 0.37 0.3.3 0.32 0.36 0.34 0.38 0.39 0.40 0.42 0.43 0.41 0.44 0.45 0.46 0.50 0.52 0.47 0.49 0.51 0.48 0.53 0.55 0.56 0.58 0.59. 1 163 . 1 182 . 1200 . 1127 . 1219 . 1.354 . 1315 . 1145 . 1.3.34 1518 1497 . 1.374 . 139 4 15.39 . 1415 . 14.35 . 1456 1626 . 1476 . 1604 1647 . 1561 . 1582 . 1091 . 1669 . 1714 1758 17:30 at x / OX APPENDIX C 301 . 0582 . 0559 . 0618 . 0571 . 0606 . 0594 . 06.30) 0694 . 0643 . 0735 . 0749 . 01808 . 0721 . 0764 1/809 . 0793 . 0918 . 0901 . 0968 . 085: . 0951 Area in Smaller Portion 9418 . 9406 . 9394 . 9429 . 9441 . 9370 9306 . 9382 |9345 9292 9265 9275 . 9357 1 9332 .931! . 9162 . 9207 . 9251 . 92.22 . 91.77 . 9147 . 9131 . 9049 . 9099 . 8997 . 9015 Area in . 8980 Larger Portion . 4441 . 4394 . 4418 . 4406 . 4 429 . 4.382 . 4.370 4.3.32 4.345 $4.306 . 4357 4275 4265 . 4.319 . 4292 . 42.51 . 42017 . 4177 4066 . 4147 . 40182 . 4(190 . 4115 . 3980) Area from . 3997 Table C . 1 Continued 1.56 1.58 1.52 1.59 1.5.3 1.54 1.55 1.57 1.51 1.50 1.47 1.45 1. 49 1.48 1.40 1.46 1 . 39 1.41 1.42 1. 37 Standard Score 2 = X / O X 1.35 1 .38 1 .36 1.32 1.31 1. 33 1 .29 1.30 1 .28 1.27 2516 2541 2492 2444 2.468 2565 2420 2371 .2:585 at x / O` . 2396 .2.290 . 2.275 . 2323 .2:347 . 2.2.27 . 2203 . 2036 . 2155 . 2107 . 2179 . 1989 . 2083 . 2059 . 2131 . 2012 . 1965 . 1942 . 1919 . 1872 . 1849 . 1895 . 17.36 Areain . 17 62 1685 Smaller Portion . 171 1 . 1060 . 1635 . 161 1 . 1562 . 1587 . 1539 . 1 423 . 1401 13.35 . 1379 . 1357 . 1314 . 1271 . 1292 . 1251 . 1210 . 1230 . 1 190 . 1056 . 1 151 . 1 1.31 . 1/12 . 1038 Larger Portion . 8238 Area in . 8289 8340 . 8365 . 8389 . 8315 8413 . 8438 8508 . 8554 - 8461 . 8599 . 8686 857 7 . 8643 8621 8665 . 8708 .8749 . 8729 8888 . 8830 . 8869 . 8849 . 8944 . 8907 . 8962 . 8925 . 8771 3289 Area from Mean to z . 32.64 3438 3.315 3461 . 32.38 3413 3365 . 3340 . 3.389 . 3485 . 3508 . 3531 . 3577 : 3590 .3686 . 3708 .3065 .3749 3770 . 3729 . 3810 . 3888 . 3869 . 3830 . 3907 3845 . 3962 SZGE" Table C. 1 Continued 300 APPENDIX Q 1. 94 Standard Score 0.93 0. 95 1.04 1.03 0.97 1. 05 1.06 0 . 98 1.08 1.00 1.07 1.09 1 .12 1. 01 1. 02 1 .14 1 .11 (1.99 1 .10 1 . 1.3 1.16 1.15 1 .20) 1 .17 1.18 1.19 1 . 22 1.24 1 . 2.3 1.26 1 . 21 1.25( continued ) .0310 1.0363 10332 10396 . 0404 . 0347 . 0325 . 0379 . 0317 . 0440 . 04.31 . 0387 . 0540 . 0519 . 04 49 . 0413 . 0478 . 0596 . 0584 . 0529 . 0459 . 05 51 . 05 62 . 0608 at * / Of APPENDIX C 303 2139 . 0150 .0136 . 0122 . 0158 . 0154 . 0160 10170 . 0174 . 0132 0256 10146 . 0162 . 0119 0212 . 0202 . 0207. . 02.28 . 0192 . 02.2.2 . 0244 . 0197 . 0233 . 0239 Smaller Portion . 9846 . 9878 . 9864 . 9826 . 9842 . 9875 . 9854 . 9838 . 9834 . 9830 . 9861 . 9881 9756 . 9821 . 9857 . 9798 . 9793 . 9817 . 9788 . 9803 . 9808 . 9778 Larger Portion . 9767 . 9761 Area in . 9744 . 4804 . 4868 . 4842 . 4801 . 4878 . 4871 . 4838 . 4826 . 4834 . 4857 . 4881 . 4830 . 4821 4744 . 4778 .4798 4750 . 4812 . 4817 4793 . 4808 .4788 . 4738 . 4772 . 4767 Area from . 4761 Mean to } Table C . 1 Continued andard Score 2.24 2 = X / O X 2.17 2.18 2.23 2.20 2.19 2.22 2.25 2.26 2.13 2.14 2.16 2. 21 2.15 2.12 1.97 2.10 1.96 2. 01 2.08 1.95 1.99 2.11 1.98 2.06 2.09 2.04 2.07 1.94 2.00 2.05 2.02 2.03 at x / Ox 1 109 1:092 . 1:040 . 1074 1057 1006 .1023 . 0989 .0973 . 0957 . 0925 . 0909 . 0893 . 0878 . 0818 . 0863 . 0833 . 0848 . 0804 . 0790 . 0761 . 0775 . 0734 . 0748 . 0721 . 0694 . 0707 . 0681 . 0609 . 0644 . 0656 . 0632 . 0620 Area in ( 4 ) 0516 0537 Smaller Portion . 0495 . 0505 . 0485 0465 10475 0455 . 04 46 . 0436 . 0409 . 0401 . 0392 . 0384 . 0367 . 0.375 . 0359 . 0.34 4 . 0351 . 03.36 0314 (0322 . 0329 . 0307 . 0301 . 0287 . 0294 . 0268 . 0274 . 0281 Larger Portion 9474 .9452 . 9484 . 9505 .9535 . 9564 . 9582 . 957.3 . 9608 .9616 . 96.33 . 9649 . 96.64 . 9641 . 9656 9678 . 9671 . 9686 . 9699 . 9706 . 9713 . 9719 . 9726 Mean to z 4474 446.3 Area from . 4484 .4452 4495 4505 . 4545 . 457.3 . 4591 . 4582 . 4599 4656 4641 4625 . 4649 . 4633 . 4604 . 4678 . 4686 469.3 . 4671 . 4699 4706 . 4713 . 4719 . 4726 4732 Table C . 1 Continued 302 APPENDIX C 2 = X / OX Standard Score 1 .61 1. 65 1.06 1 .60 1 .62 1. 67 1. 68 1. 64 1. 69 1.70 1.74 1 . 72 1 .71 1 .73 1 .76 1.75 1.77 1 .78 1.79 1 . 82 1 . 80 ) 1.84 1.81 1.83 1.88 1.85 1 .86 1.90 1 . 91 1.87 1. 92 1.89 1. 93(continued) 0056 0053 0055 0051 .0065 .0058 .0079 .0067 .0061 .0073 0122 0110 0104 9600 0116 .0091 .0093 .0075 0129 0113 .0071 0126 0107 .0077 0101 at x/0x APPENDIX C 305 .0016 .0016 0018 .0018 0026 .0017 0021 .0022 .0032 .0023 044 .0034 .0023 .0024 .0033 .0028 .0025 .0035 0043 .0030 .0029 .0036 .0027 .0031 .0021 .0041 Smaller Portion Area in .0038 .9984 .9983 .9982 .9976 .9979 .9982 .9977 .9968 .9970 .9977 .9969 .9981 .9974 .9966 .9967 9956 .9964 Area in .9971 .9972 .9957 Larger Portion .4983 .4984 4981 4981 4971 .4977 .4979 .4976 4969 .4972 .4962 .4968 .497 .4965 .4964 .4957 .4967 Mean to z Area from Table C.I Continued Standard Score 2.94 2.95 2.93 2.79 2.80 2.92 2.85 25 x/0x 2.89 2.90 2.81 2.82 2.84 2.87 2.83 2.86 2.91 2.88 2.62 2.63 2.74 2.66 2.67 2.70 2.71 2.72 2.73 2.75 2.76 2.77 2.78 2.6 2.6! at x/0 .0303 0297 0290 0283 :0270 .0264 .0258 .0235 0224 .0229 .0219 .024 .0213 .0208 .0203 .0198 .0184 .0180 .0175 .0171 .0158 .0154 0136 .0167 .0163 .0151 .0143 0139 .0132 Area in Smaller Portion .0113 0096 0094 .0110 .0104 .0102 0091 .009 .0089 .0087 .0082 .0084 .0080 .007 .0068 .0075 .0066 .0073 .0071 .0064 .0059 .0055 0052 .0054 0051 .0045 Area in Larger Portion 9884 .9890 9896 .9898 .9893 .9901 9904 .9911 .9906 .9909 .9913 .9916 .9918 0925 .9920 9929 .992: .9927 .9931 .9932 .9936 .9934 .9938 .9940 .9941 .9945 .9946 .994.3 .9948 .9949 .9951 .9953 Area from Mean to z .4884 4887 .4890 .4896 .4893 .4898 4904 .4901 4906 .4909 .4911 .4913 .4916 4922 4925 .4927 .4929 .4932 .4934 .4936 .4931 .4941 .4943 493 .4945 4948 .4949 .4952 .4951 .4955 .4953 Table C. I Continued 304 APPENDIX Standard Score z = x/Ox E 2.27 2.28 2.29 2.30 2.31 2.32 2.33 2.34 2.35 2.36 2.38 2.40 2.39 2.41 2.42 2.43 2.44 2.45 2.47 2.48 2.49 2.50 2.51 2.52 2.53 2.54 2.55 2.56 2.57 2.58 2.59 2.60 2.61Council on Measurement in Education . ( 1999 ) . Standards for educational and psychological testing American Association for Counseling and Development . ( 1988 ) . Responsibilities of users of standard- practitioners coping with subpoenas or compelled testimony for client records or test data . Aiken , L . R. ( 1996 ) . Rating scales and check lists : Evaluating behavior , personality and attitudes . New York; American Psychological Association . ( 2001 ) . Publication manual of the American Psychological Associa Abelson , R . P. ( 1997 ). On the surprising longevity of flogged horses : Why there is a case for the American ! ' ducational Research Association , American Psychological Association , & National Washington , DC : Author . Retrieved July 5 , 2003 from the World Wide Web : http : / / www intraub server reliability , and the Rorschach Comprehensive System . Journal of Personality American Psychological Association , American Educational Research Association , & National Council on Measurement in Education . ( 1974 ) . Standards for educational ` psychological tests . American Psychological Association , Committee on Legal Issues . ( 1996 ) . Strategies for private Acklin , M. W., McDowell , C . J. , Verschell , M. S. , & Chan , D. ( 20,010) . Interobserver agreement , American Psychological Association . ( 2000 ) . Report of the task force on test user qualifications . Wash- American Counseling Association . ( 1995 ) . Code of ethics and standards of practice. Alexandria, VA. ( 20(.3 ) . Statement on the use of secure psychological tests in the education of graduate and undergraduate American Psychological Association . ( 1953 ) . Ethical standards of psychologists . Washington , DC. American Psychiatric Association . ( 1994 ) . Diagnostic and statistical manual of mental disorders ( 4#` American Psychological Association . ( 2002 ) . Ethical principles of psychologists and code of American Psychological Association . ( 1954 ) . Technical recommendations for psychological tests and Aiken , I. R. ( 1997 ) . Questionnaires and inventories :" Surveying opinions and assessing personality. New American Psychological Association . ( 200.3 ) . FAQ / Finding information about psychological tests .` American Psychological Association . ( 1960 ) . Standards for educational and psychological tests and* American Psychological Association , Committee on Psychological " Tests and Assessment . American Psychological Association , Committee on Psychological Tests and Assessment ( 1996 ) . Statement on the disclosure of test data . American Psychologist , 51 , 644 - 648 .` Washington , DC : American [iducational Research Association ." Washington , DC: American Psychological Association .\\ Professional Psychology: Research and Practice , 27 , 245 - 251 .` significance test . Psychological Science , 8 , 12 - 15 .\\ diagnostic techniques . Washington , DC : Author .\\ conduct . American Psychologist , 57 , 1060- 1073 .\\ tion ( 5 th ed . ) . Washington , DC : Author .* . apa. org / science / faq- findtests . html* ized tests . Washington , DC: Author .* manuals . Washington , DC . Author .\\ (d . ) . Washington , DC : Author .\\ Assessment , 74 , 15 - 47 .` ington , DC: Author .\\ References York : Wiley .* Author .\\ Author .\\ Wiley .\\ 307 . 0050 . 0048 at x / OX ( 5 ) . 0044 . 0047 . 0046 . 0040 1 0.043 . 0042 . 0039 . 0036 . 0038 . 0037 . 0 035 . 0 0.34 . 0033 . 0032 . 0030 . 002.9 1 0.031 1 0.028 . 0026 . 002.5 . 0027 . 002.5 . 0024 . 0023 . 002.2 . 0022 . 0 012 . 0017 . 0004 . 0006 . 0009 Areain Smaller Portion . 0014 ( 4 ) . 0015 . 0014 . 0015 . 001.3 . 001.3 . 0012 . 0012 . 001 1 . 0010 . 0011 . 0010 . 001 1 . 0010 8000 . 0009 . 0008 . 0009 . 0009 . 0008 . 0008 . 0007 10007 . 0007 . 0006 . 0006 . 0006 . 0005 . 0003 . 0002 . 0002 . 0001 9986 Area in 9986 . 9985 Larger Portion . 9985 ( 4 ) $9988 1 9987 . 9988 . 9987 . 9987 . 9989 .2990 . 9 989 . 9 990 1 9989 . 9 990 . 9991 . 9991 . 9991 . 9992 . 9992 . 9992 . 9992 . 9993 . 2993 . 9993 . 999.3 . 9994 . 9994 . 9994 . 9995 . 9998 . 2998 . 9997 . 999 9 Note :" The entries in this table were generated using a computer program . Mean to z Area from . 4985 . 4985 . 4986 . 4986 \\( 2 ) . 4987 . 4987 . 4988 4988 . 4987 $4950 . 4990 . 4989 . 4990 4985 . 4989 . 4991 . 4991 . 4992 . 4991 . 4992 . 4992 . 49 92 . 4993 . 4993 . 4993 . 4993 . 4994 . 4994 . 4994 . 4998 . 4995 . 4997 . 4998 .49 95 Table C .1 Continued 306 APPENDIX C Standard Scord 2 = X / OX ( 1 ) 2.97 2.98 2.90 3.00 3.01 2.96 3. 012 3. 01.3 3.05 3. 04 3.06 3.07 3. 018 3. 019 3.10 3.15 3.16 3.11 3.18 3.12 3.14 3.1.3 3.19 3.17 3.20 3.21 3.22 3.24 3.23 3.40 3.50 3. 30 ) 3. 60 ) 3. 70)