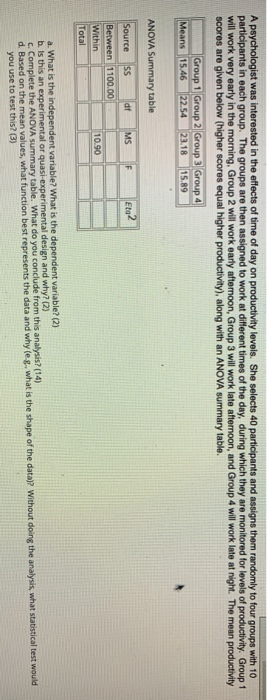
A psychologist was interested in the effects of time of day on productivity levels. She selects 40 participants and assigns them randomly to four groups with 10 participants in each group. The groups are then assigned to work at different times of the day, during which they are monitored for levels of productivity. Group 1 will work very early in the morning, Group 2 will work early afternoon, Group 3 will work late afternoon, and Group 4 will work late at night. The mean productivity scores are given below (higher scores equal higher productivity), along with an ANOVA summary table. Group 1 Group 2 Group 3 Group 4 Means 15.46 22.54 23.18 15.89 ANOVA Summary table at MS F Eta2 Source SS Between 1100.00 Within Total 10.90 a. What is the independent variable? What is the dependent variable? (2) b. Is this an experimental or quasi-experimental design and why? (2) c. Complete the ANOVA summary table. What do you conclude from this analysis? (14) d. Based on the mean values, what function best represents the data and why leg, what is the shape of the data)? Without doing the analysis, what statistical test would you use to test this? (3) A psychologist was interested in the effects of time of day on productivity levels. She selects 40 participants and assigns them randomly to four groups with 10 participants in each group. The groups are then assigned to work at different times of the day, during which they are monitored for levels of productivity. Group 1 will work very early in the morning, Group 2 will work early afternoon, Group 3 will work late afternoon, and Group 4 will work late at night. The mean productivity scores are given below (higher scores equal higher productivity), along with an ANOVA summary table. Group 1 Group 2 Group 3 Group 4 Means 15.46 22.54 23.18 15.89 ANOVA Summary table at MS F Eta2 Source SS Between 1100.00 Within Total 10.90 a. What is the independent variable? What is the dependent variable? (2) b. Is this an experimental or quasi-experimental design and why? (2) c. Complete the ANOVA summary table. What do you conclude from this analysis? (14) d. Based on the mean values, what function best represents the data and why leg, what is the shape of the data)? Without doing the analysis, what statistical test would you use to test this? (3)


