

Question
A random sample of 160 car purchases are selected and categorized by age The results are listed below The age distribution of drivers for the

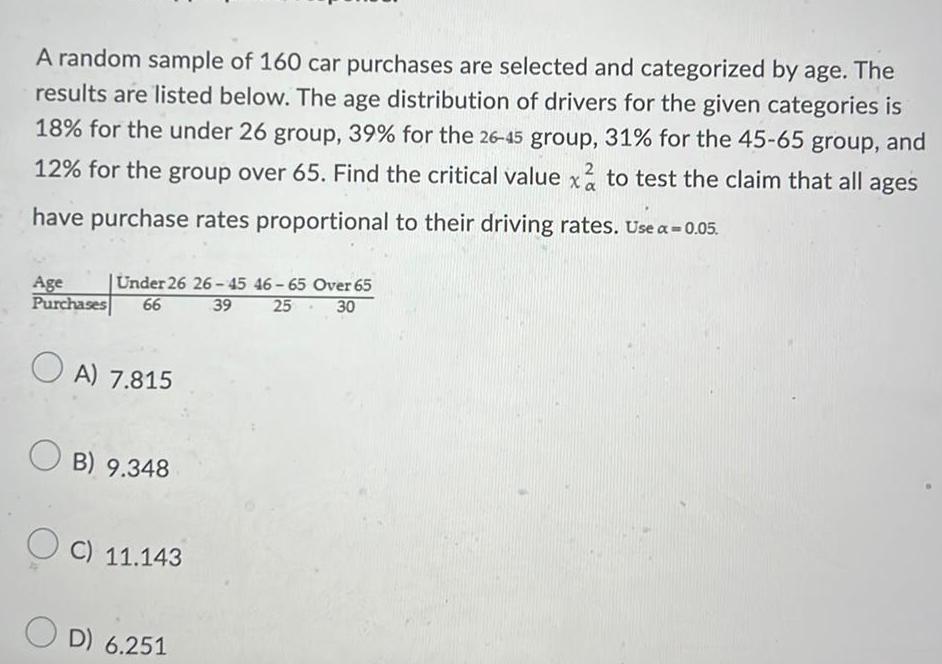
A random sample of 160 car purchases are selected and categorized by age The results are listed below The age distribution of drivers for the given categories is 18 for the under 26 group 39 for the 26 45 group 31 for the 45 65 group and 12 for the group over 65 Find the critical value xa to test the claim that all ages 2 have purchase rates proportional to their driving rates Use a 0 05 Age Under 26 26 45 46 65 Over 65 Purchases 66 39 25 30 OA 7 815 OB 9 348 OC 11 143 OD 6 251
Step by Step Solution
There are 3 Steps involved in it
Step: 1

Get Instant Access to Expert-Tailored Solutions
See step-by-step solutions with expert insights and AI powered tools for academic success
Step: 2

Step: 3
Ace Your Homework with AI
Get the answers you need in no time with our AI-driven, step-by-step assistance
Get Started
Visual Differential Geometry And Forms A Mathematical Drama In Five Acts
Authors: Tristan Needham
1st Edition
0691219893, 9780691219899