Answered step by step
Verified Expert Solution
Question
1 Approved Answer
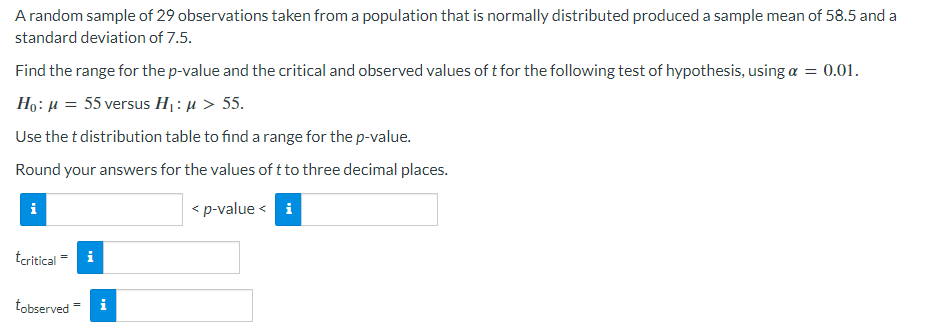
A random sample of 29 observations taken from a population that is normally distributed produced a sample mean of 58.5 and a standard deviation

A random sample of 29 observations taken from a population that is normally distributed produced a sample mean of 58.5 and a standard deviation of 7.5. Find the range for the p-value and the critical and observed values of t for the following test of hypothesis, using a = 0.01. Ho: = 55 versus H: > 55. Use the t distribution table to find a range for the p-value. Round your answers for the values of t to three decimal places. i < p-value
Step by Step Solution
There are 3 Steps involved in it
Step: 1
Calculate the test statistic t observed using the formula t ob...
Get Instant Access to Expert-Tailored Solutions
See step-by-step solutions with expert insights and AI powered tools for academic success
Step: 2

Step: 3

Ace Your Homework with AI
Get the answers you need in no time with our AI-driven, step-by-step assistance
Get Started


