Answered step by step
Verified Expert Solution
Question
1 Approved Answer
A random sample of 30 colleges from Kiplinger's list of the best values in private college provided the data shown in the file BestPrivateColleges (Kiplinger
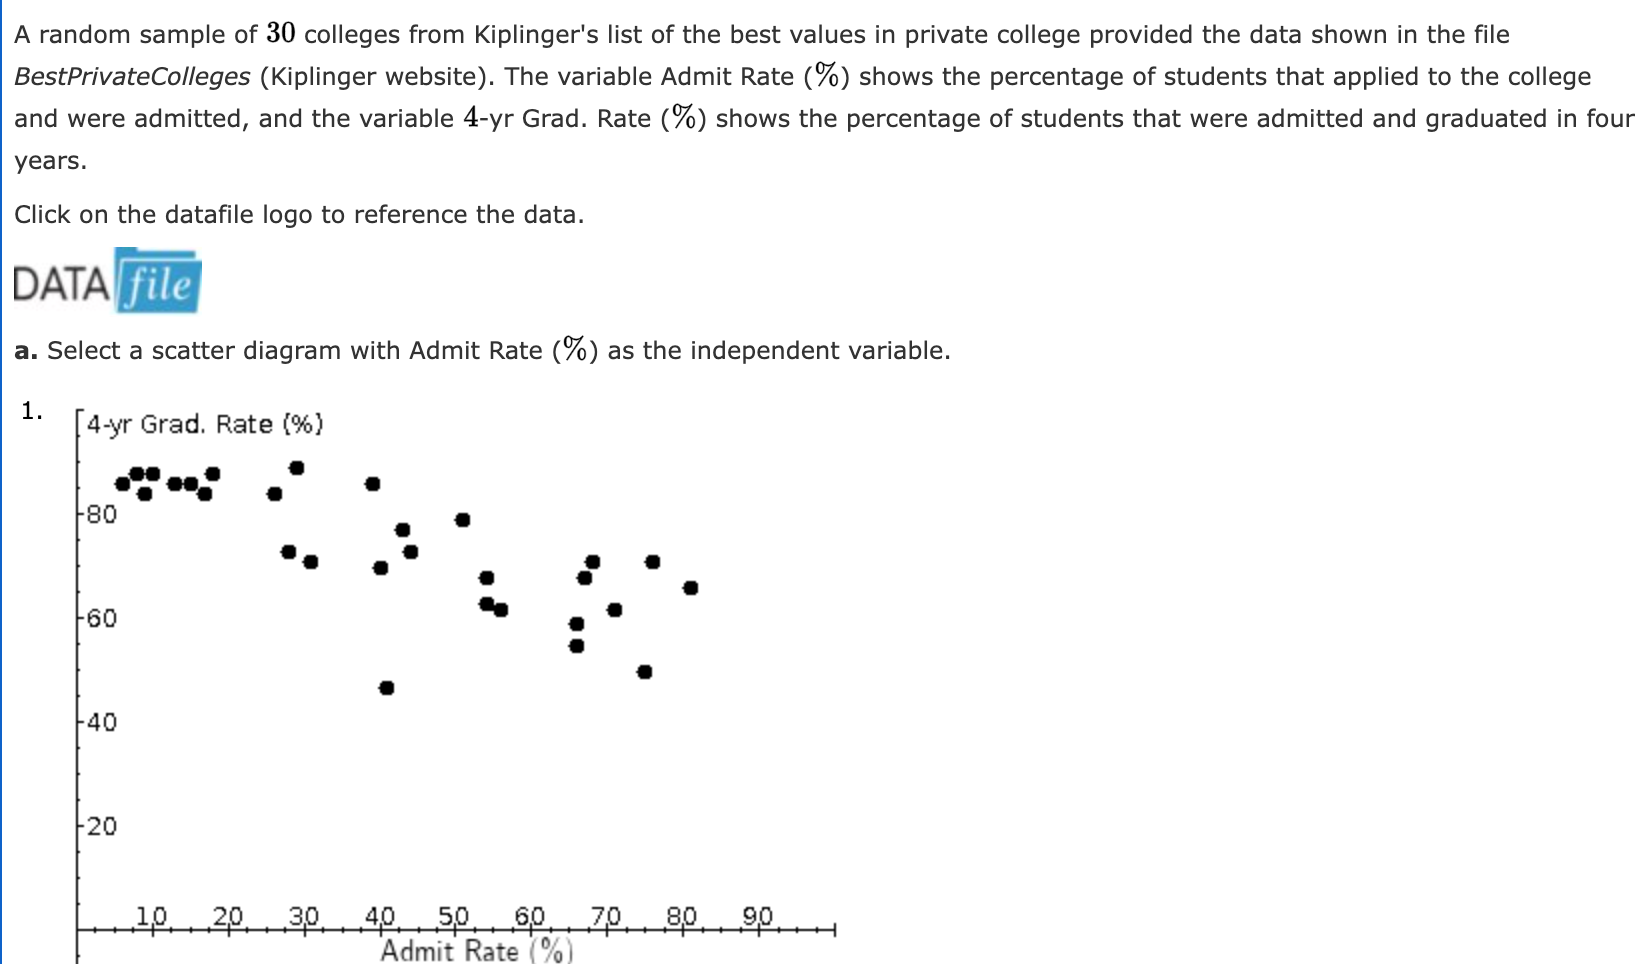
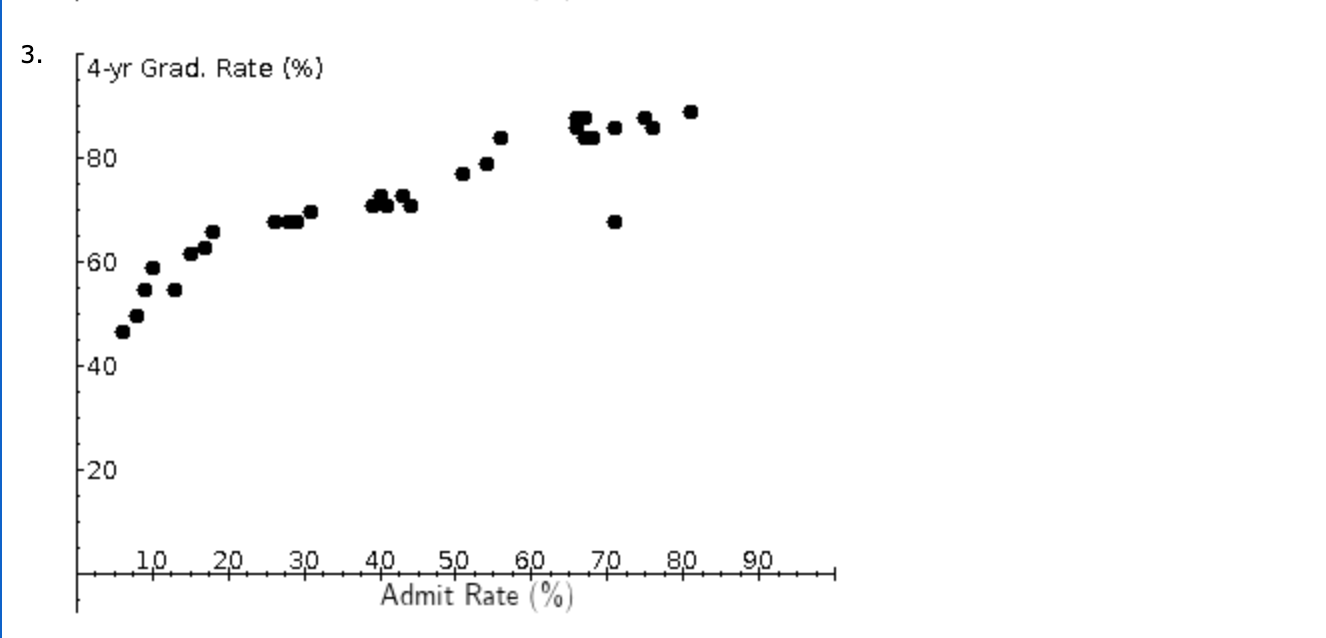
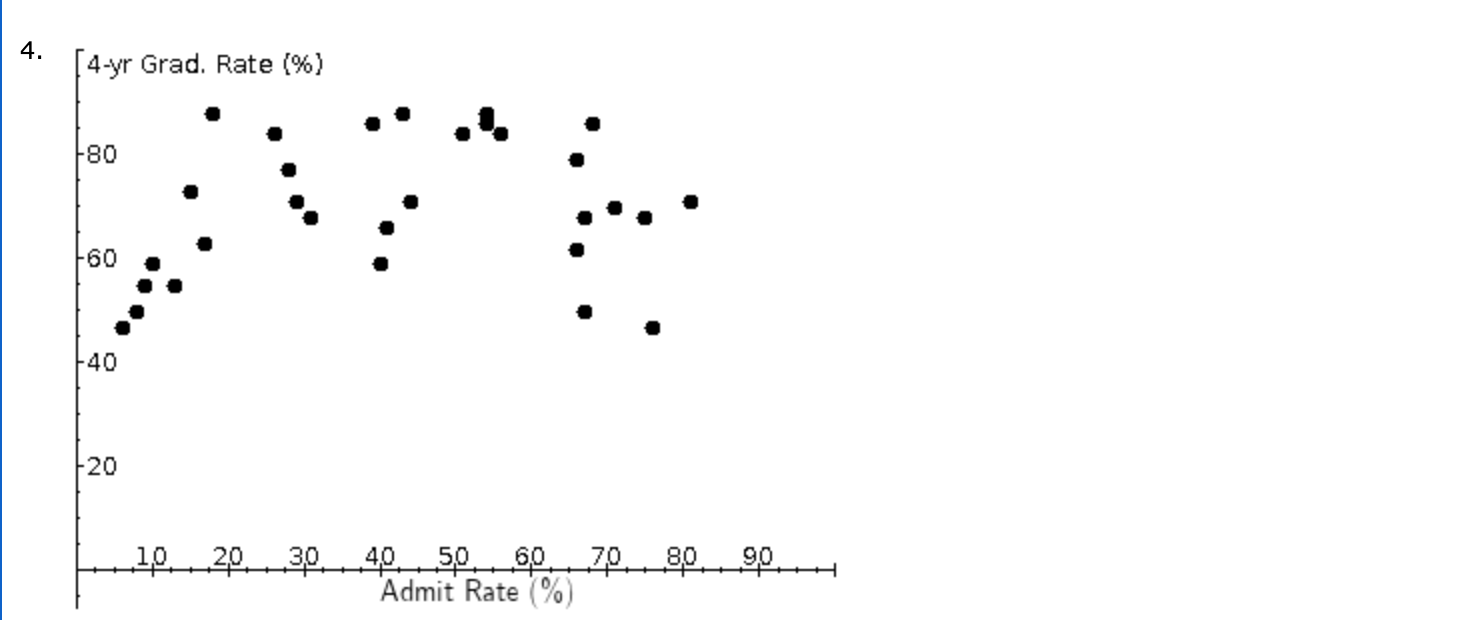
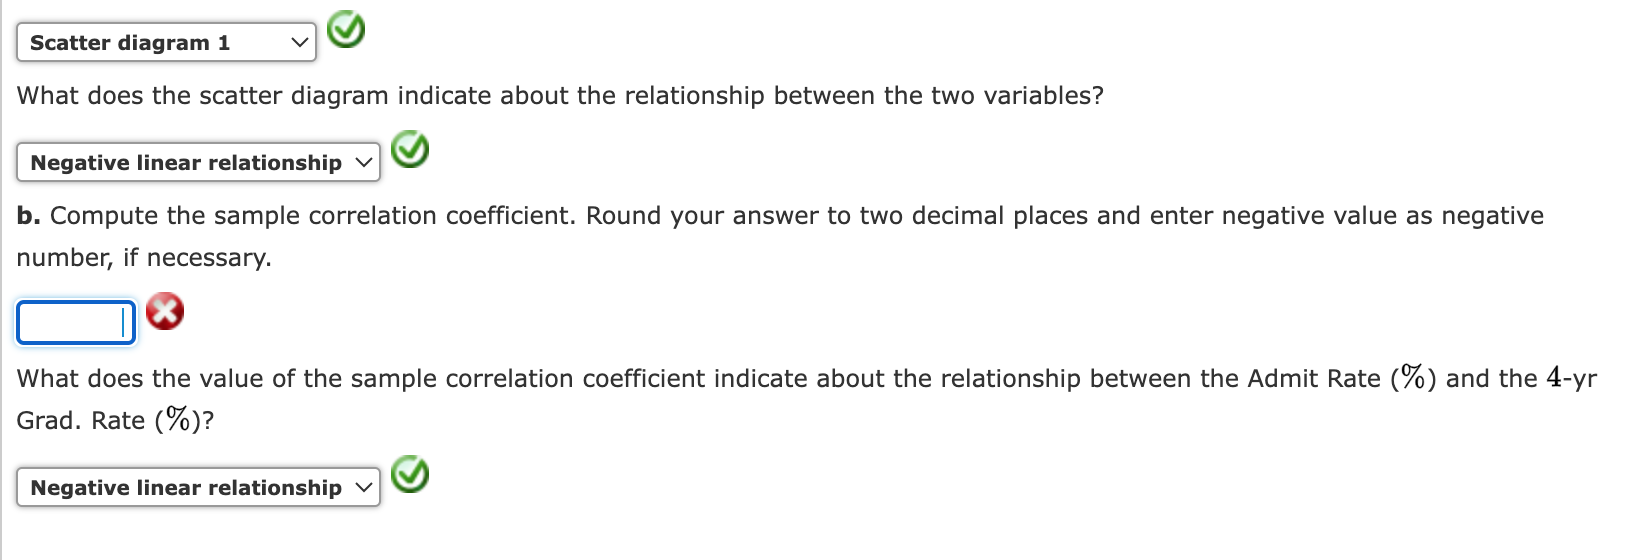
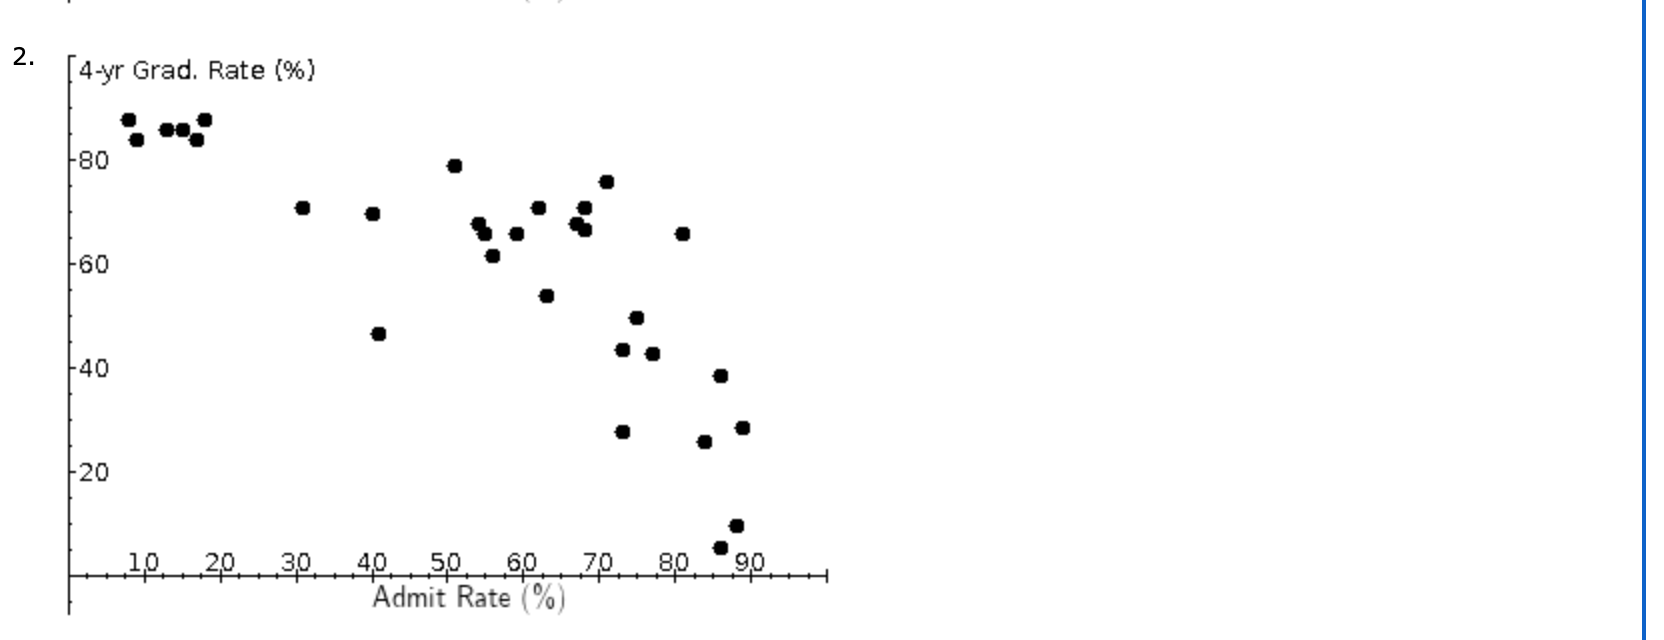
A random sample of 30 colleges from Kiplinger's list of the best values in private college provided the data shown in the file BestPrivateColleges (Kiplinger website). The variable Admit Rate (%) shows the percentage of students that applied to the college and were admitted, and the variable 4-yr Grad. Rate (%) shows the percentage of students that were admitted and graduated in four years. Click on the datafile logo to reference the data. DATA i a. Select a scatter diagram with Admit Rate (%) as the independent variable. 1 d4-yr Grad. Rate (%) el e 80 . . . * - e .. * - @ a o 40 20 Admit Rate (%] \f\f\fScatter diagram 1 v @ What does the scatter diagram indicate about the relationship between the two variables? Negative linear relationship v @ b. Compute the sample correlation coefficient. Round your answer to two decimal places and enter negative value as negative number, if necessary. e What does the value of the sample correlation coefficient indicate about the relationship between the Admit Rate (%) and the 4-yr Grad. Rate (%)? Negative linear relationship v @
Step by Step Solution
There are 3 Steps involved in it
Step: 1
Get Instant Access to Expert-Tailored Solutions
See step-by-step solutions with expert insights and AI powered tools for academic success
Step: 2
Step: 3
Ace Your Homework with AI
Get the answers you need in no time with our AI-driven, step-by-step assistance
Get Started