Answered step by step
Verified Expert Solution
Question
1 Approved Answer
A random sample of eight house prices (in thousands ofS) in a large city yields the following: X= (252, 126, 84, 216. 120, 105,


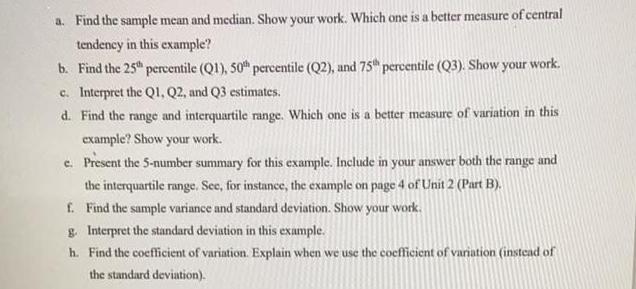
A random sample of eight house prices (in thousands ofS) in a large city yields the following: X= (252, 126, 84, 216. 120, 105, 231, 210) a. Find the sample mean and median. Show your work. Which one is a better measure of central tendency in this example? b. Find the 25th percentile (Q1), 50 percentile (Q2), and 75 percentile (Q3). Show your work. c. Interpret the Q1, Q2, and Q3 estimates. d. Find the range and interquartile range. Which one is a better measure of variation in this example? Show your work. e. Present the 5-number summary for this example. Include in your answer both the range and the interquartile range. See, for instance, the example on page 4 of Unit 2 (Part B). f. Find the sample variance and standard deviation. Show your work. g. Interpret the standard deviation in this example. h. Find the coefficient of variation. Explain when we use the coefficient of variation (instead of the standard deviation).
Step by Step Solution
★★★★★
3.33 Rating (147 Votes )
There are 3 Steps involved in it
Step: 1

Get Instant Access to Expert-Tailored Solutions
See step-by-step solutions with expert insights and AI powered tools for academic success
Step: 2

Step: 3

Ace Your Homework with AI
Get the answers you need in no time with our AI-driven, step-by-step assistance
Get Started


