

Question
A random sample of n 10 regions in New England gave the following violent crime rates per million population x New England Crime Rate 3
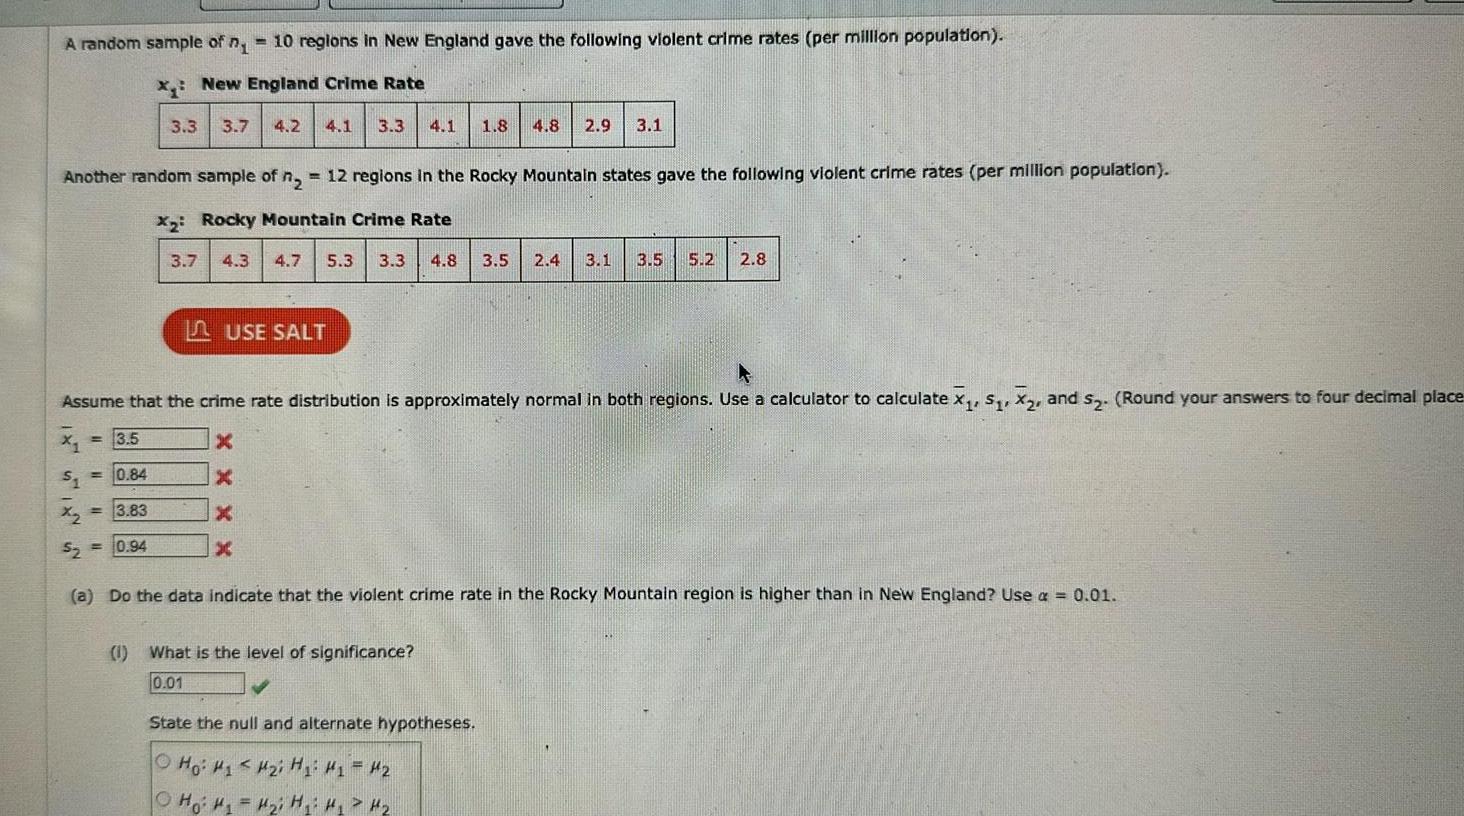

A random sample of n 10 regions in New England gave the following violent crime rates per million population x New England Crime Rate 3 3 3 7 4 2 4 1 3 3 4 1 1 8 4 8 Another random sample of n 12 regions in the Rocky Mountain states gave the following violent crime rates per million population X Rocky Mountain Crime Rate IX 3 5 3 7 S 1 0 84 X 3 83 20 94 4 3 4 7 5 3 3 3 4 8 3 5 USE SALT Assume that the crime rate distribution is approximately normal in both regions Use a calculator to calculate x S X and S Round your answers to four decimal place X X X 2 9 3 1 1 What is the level of significance 0 01 2 4 3 1 3 5 5 2 2 8 a Do the data indicate that the violent crime rate in the Rocky Mountain region is higher than in New England Use 0 01 State the null and alternate hypotheses H i Hi Hi Hi Hi 12 H H H i H H H
Step by Step Solution
There are 3 Steps involved in it
Step: 1

Get Instant Access to Expert-Tailored Solutions
See step-by-step solutions with expert insights and AI powered tools for academic success
Step: 2

Step: 3
Ace Your Homework with AI
Get the answers you need in no time with our AI-driven, step-by-step assistance
Get Started
Elementary Differential Geometry
Authors: Barrett O'Neill
1st Edition
148326811X, 9781483268118