

Answered step by step
Verified Expert Solution
Question
1 Approved Answer
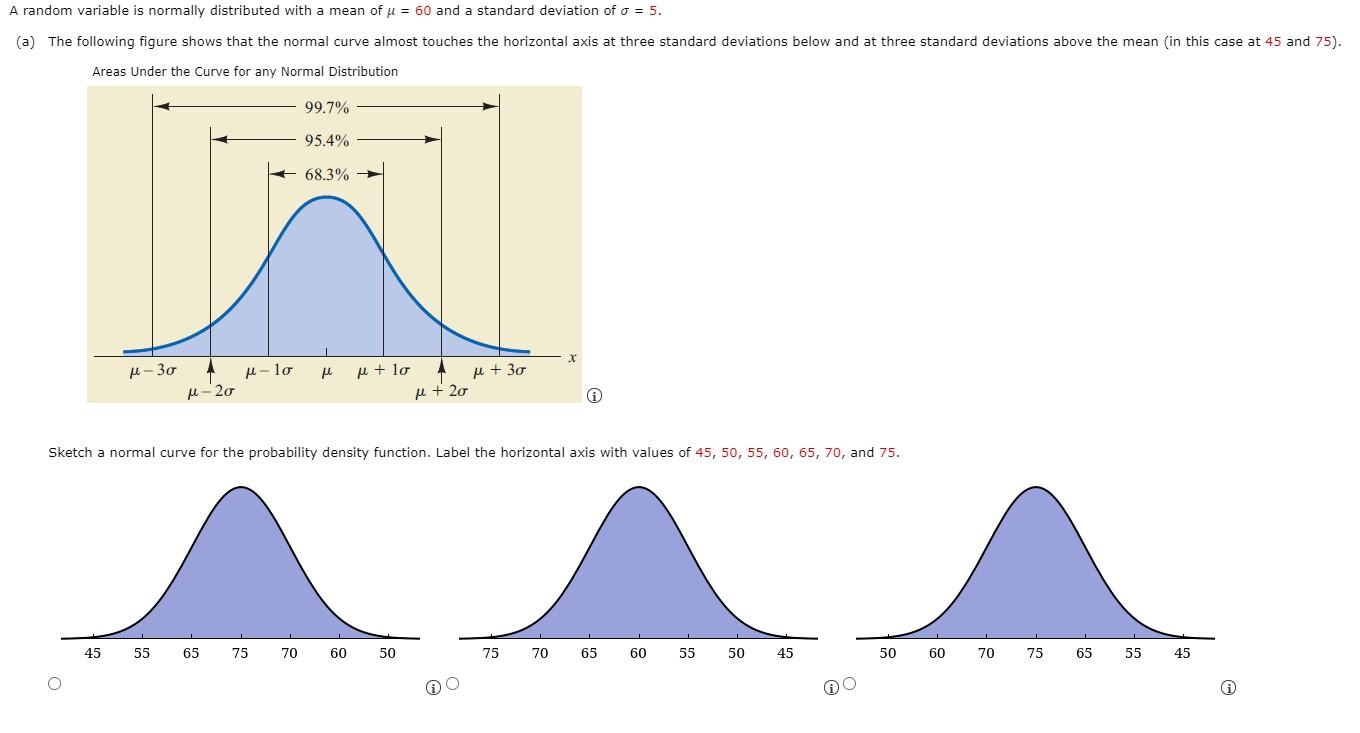
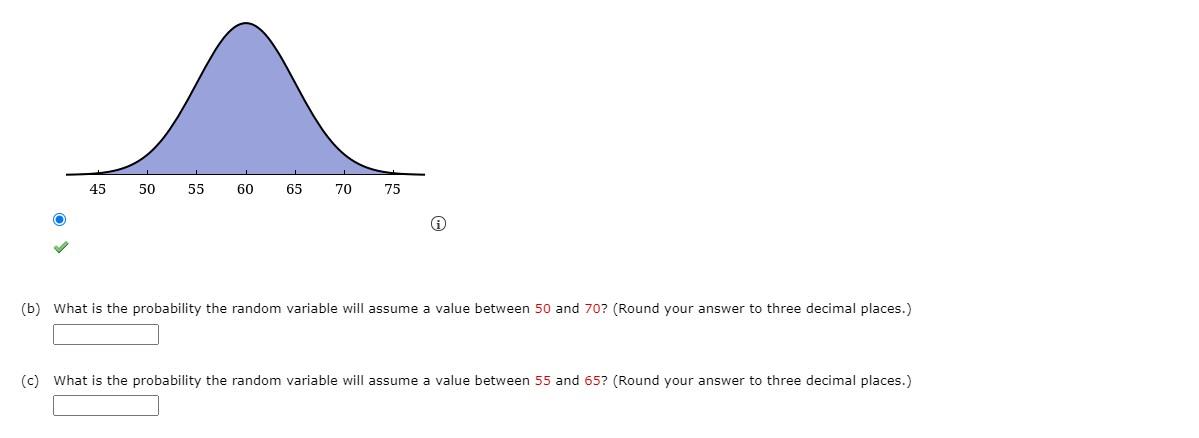
A random variable is normally distributed with mean of u = 60 and a standard deviation of o = 5. (a) The following figure shows
Step by Step Solution
There are 3 Steps involved in it
Step: 1

Get Instant Access to Expert-Tailored Solutions
See step-by-step solutions with expert insights and AI powered tools for academic success
Step: 2

Step: 3
Ace Your Homework with AI
Get the answers you need in no time with our AI-driven, step-by-step assistance
Get Started
Advanced Financial Accounting
Authors: Theodore Christensen, David Cottrell, Cassy Budd
13th Edition
1260772136, 9781260772135