Answered step by step
Verified Expert Solution
Question
1 Approved Answer
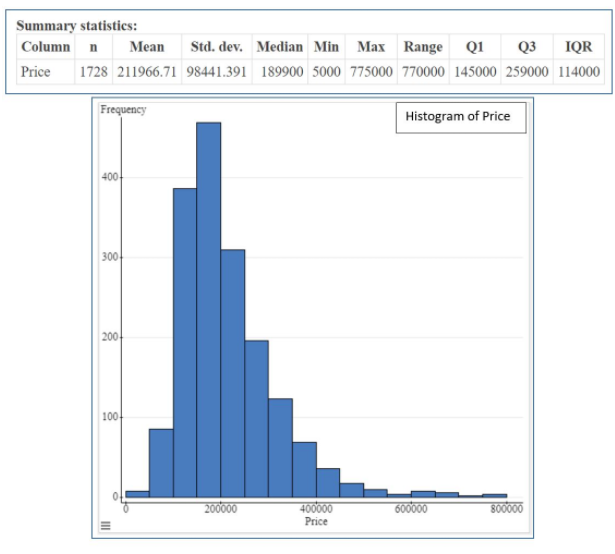
A real estate agent took a sample of homes for sale in the Northwest TN region to analyze home prices. In the two visuals below
A real estate agent took a sample of homes for sale in the Northwest TN
region to analyze home prices. In the two visuals below you will find the statistics for these home prices and the histogram of these home prices.

Step by Step Solution
There are 3 Steps involved in it
Step: 1

Get Instant Access to Expert-Tailored Solutions
See step-by-step solutions with expert insights and AI powered tools for academic success
Step: 2

Step: 3

Ace Your Homework with AI
Get the answers you need in no time with our AI-driven, step-by-step assistance
Get Started


