

Answered step by step
Verified Expert Solution
Question
1 Approved Answer
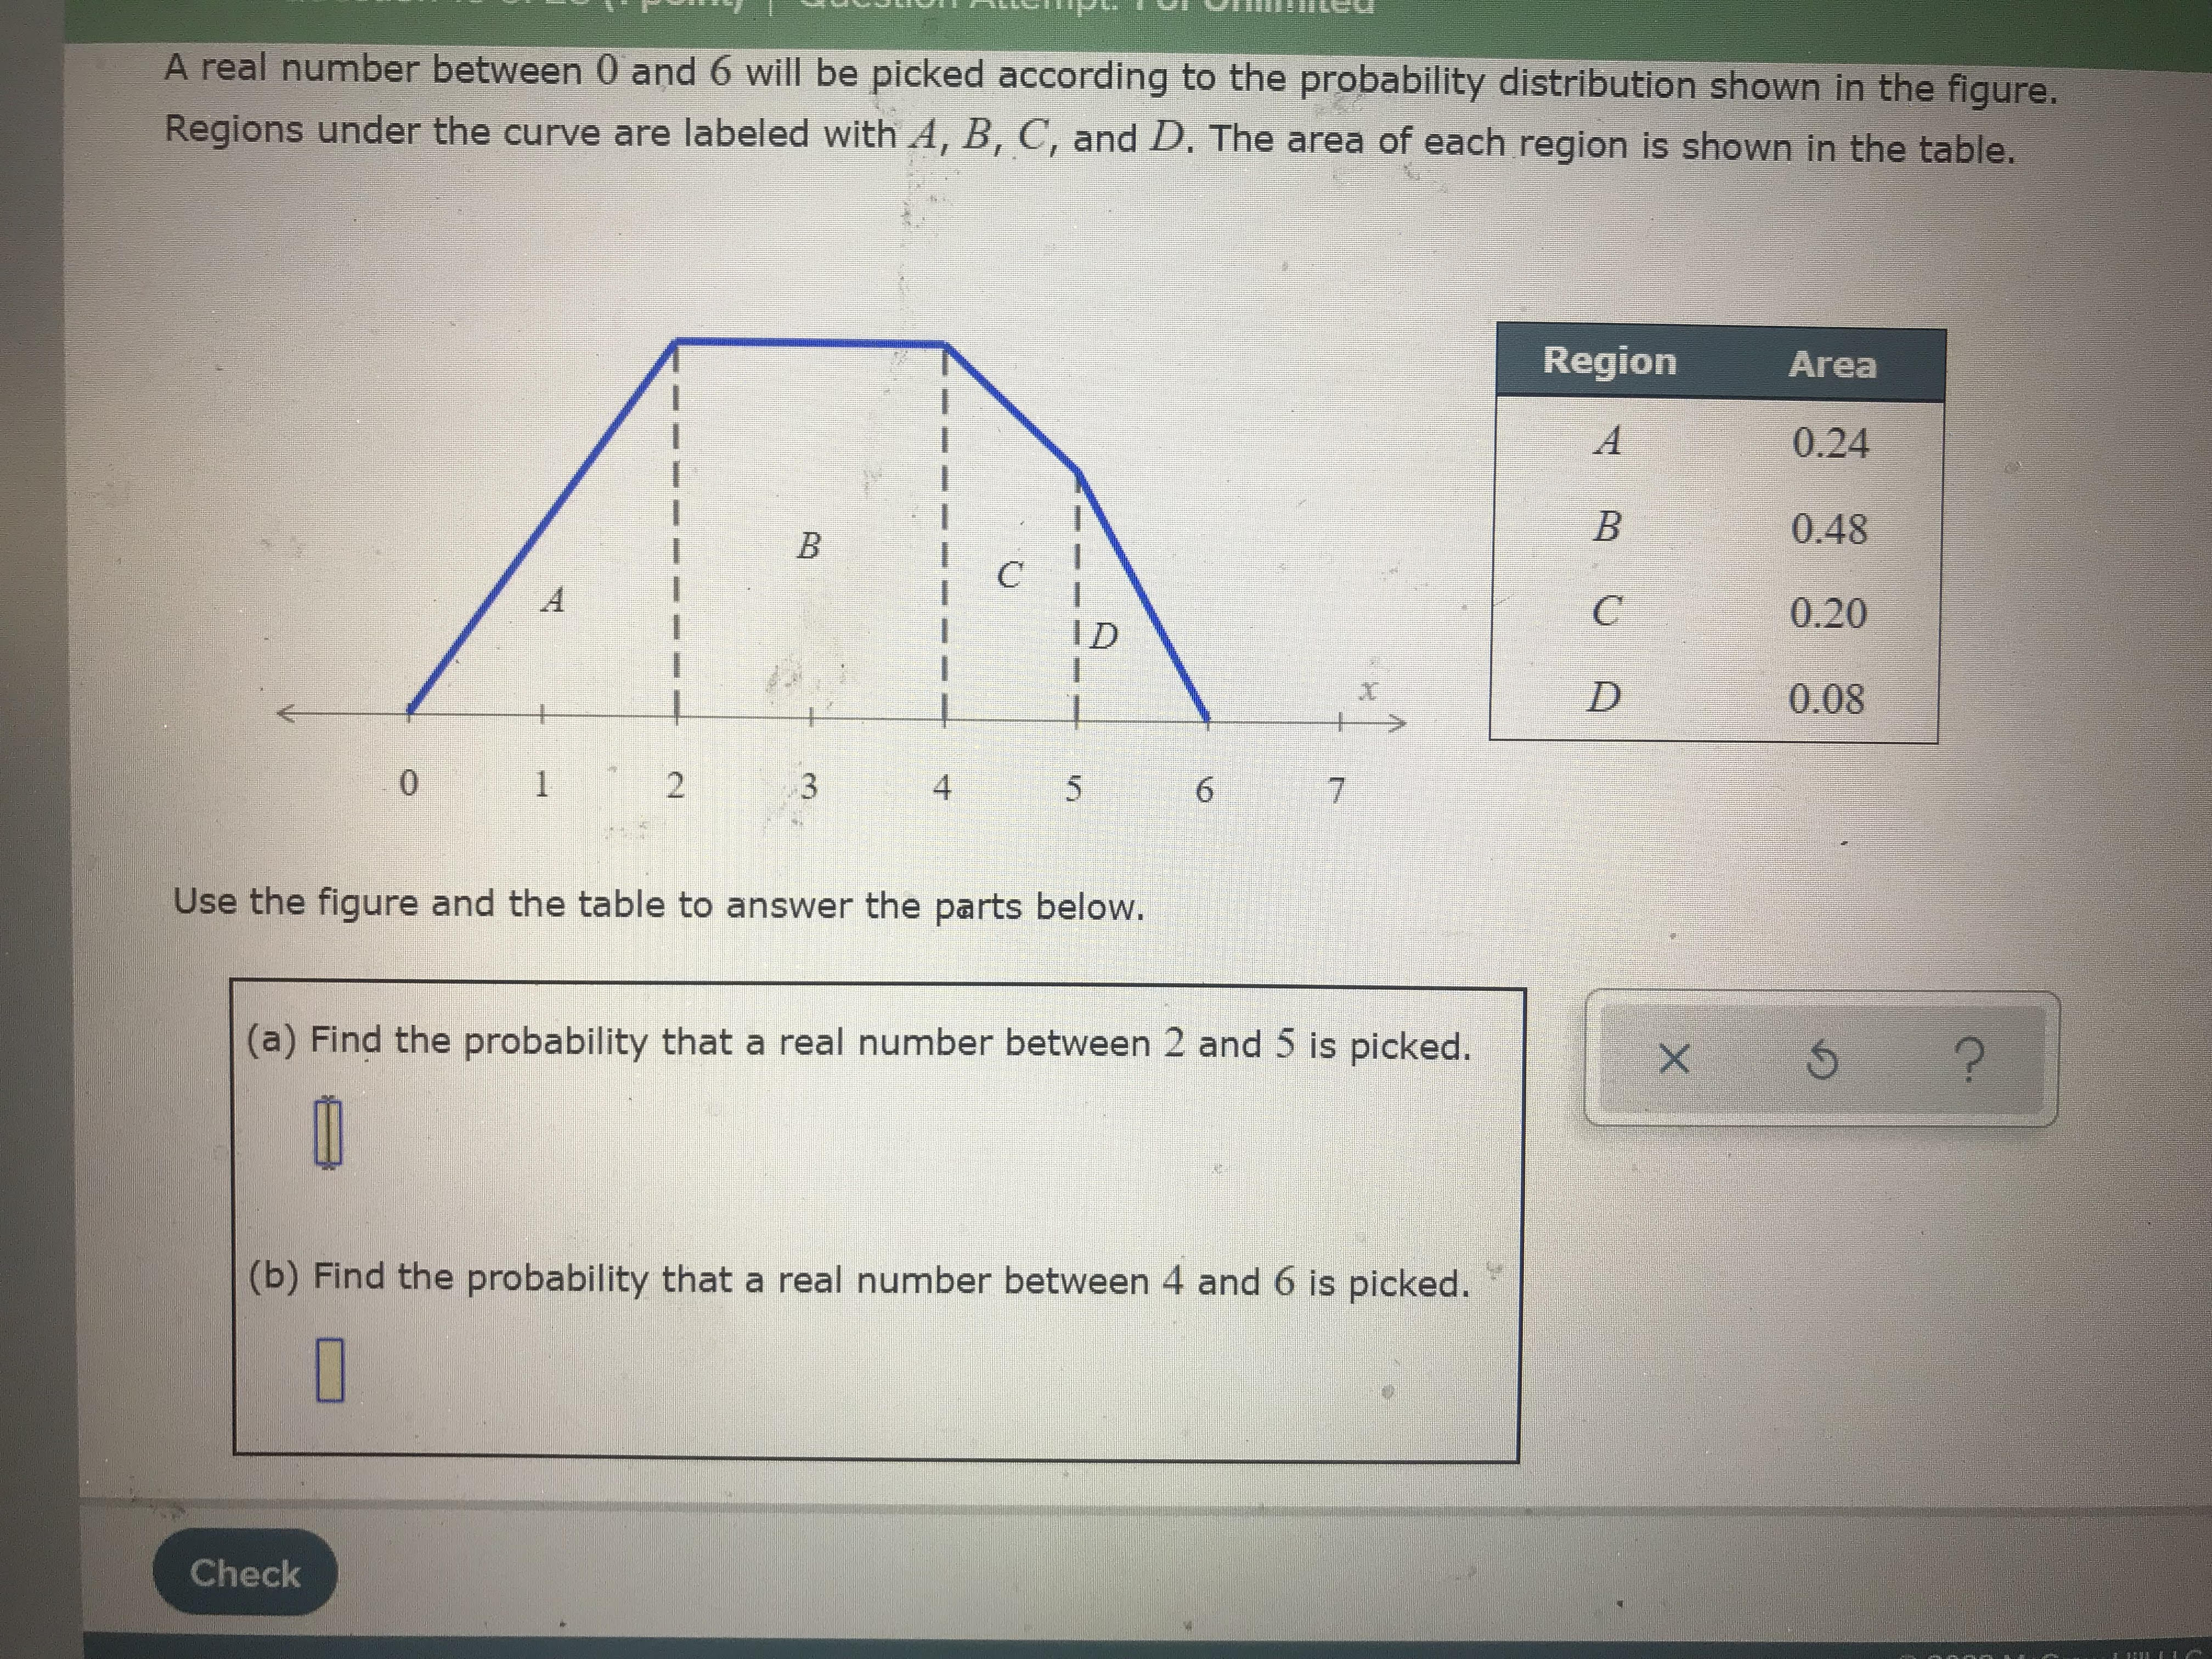
A real number between 0 and 6 will be picked according to the probability distribution shown in the figure. Regions under the curve are labeled

Step by Step Solution
There are 3 Steps involved in it
Step: 1

Get Instant Access to Expert-Tailored Solutions
See step-by-step solutions with expert insights and AI powered tools for academic success
Step: 2

Step: 3
Ace Your Homework with AI
Get the answers you need in no time with our AI-driven, step-by-step assistance
Get Started
Elementary Number Theory
Authors: Underwood Dudley
1st Edition
0486134873, 9780486134871