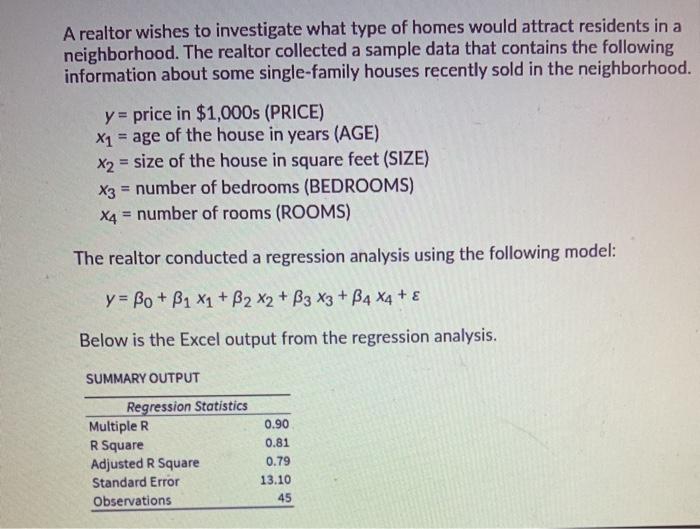
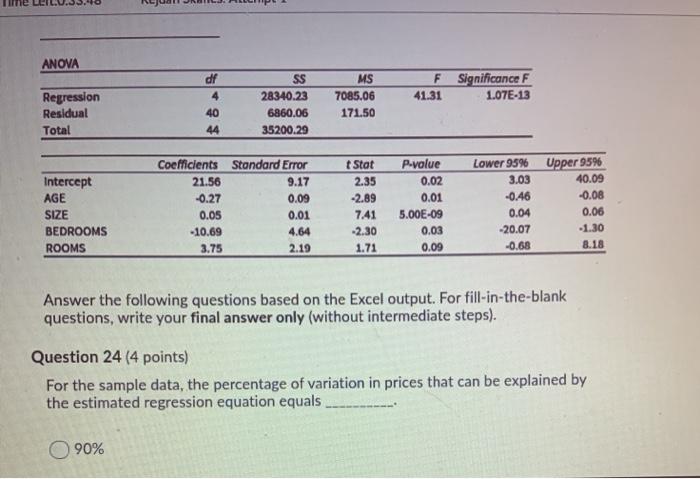
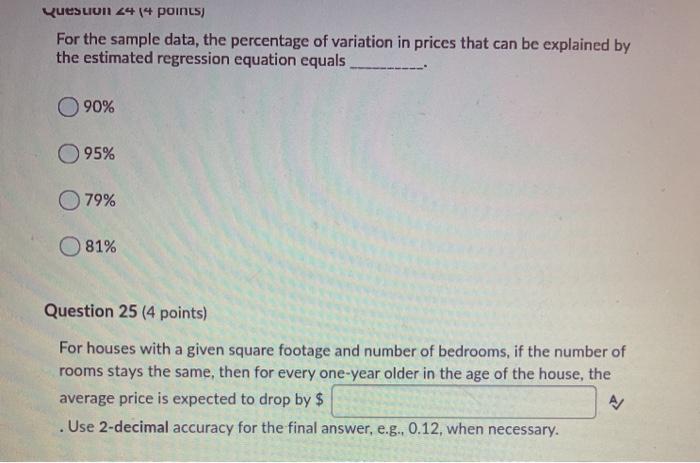
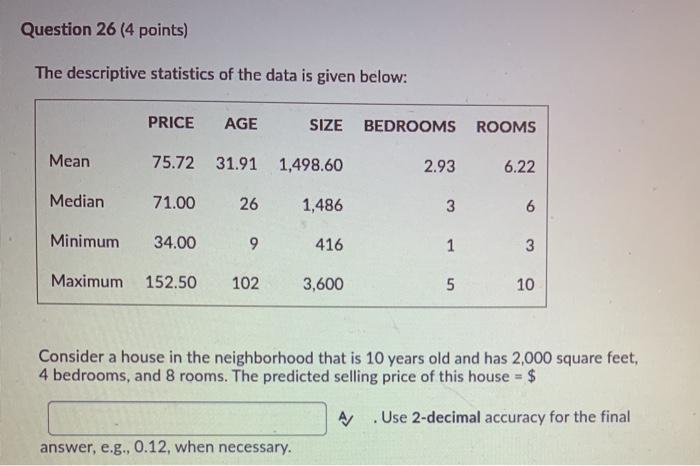
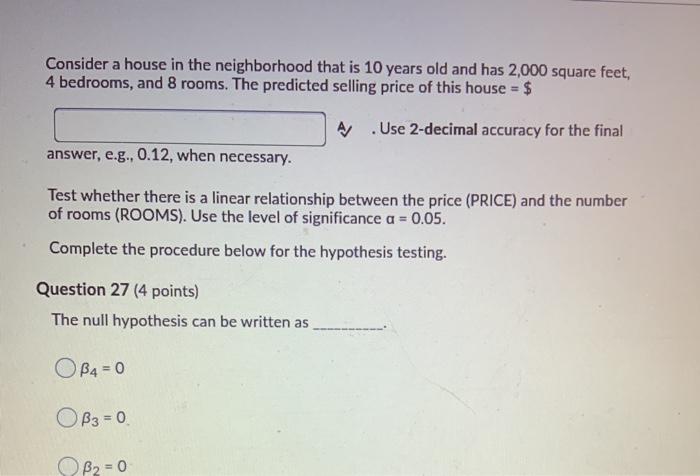
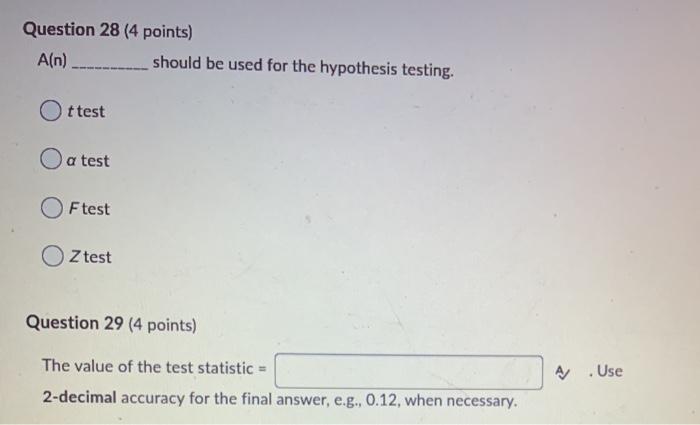
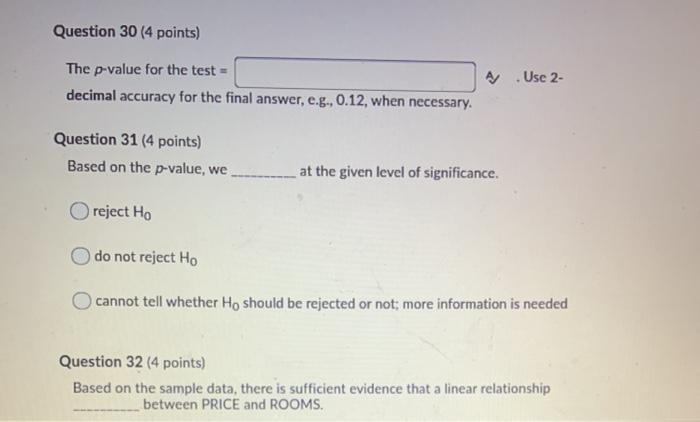
A realtor wishes to investigate what type of homes would attract residents in a neighborhood. The realtor collected a sample data that contains the following information about some single-family houses recently sold in the neighborhood. y = price in $1,000s (PRICE) x1 = age of the house in years (AGE) X2 = size of the house in square feet (SIZE) x3 = number of bedrooms (BEDROOMS) X4 = number of rooms (ROOMS) The realtor conducted a regression analysis using the following model: y = Bo + B1 X1 + B2 X2 + B3 X3 + B4 x4 + Below is the Excel output from the regression analysis. SUMMARY OUTPUT Regression Statistics Multiple R R Square Adjusted R Square Standard Error Observations 0.90 0.81 0.79 13.10 45 ANOVA F Significance F 41.31 1.07E-13 Regression Residual Total df 4 40 44 SS 28340.23 6860.06 35200.29 MS 7085.06 171.50 Intercept AGE SIZE BEDROOMS ROOMS Coefficients Standard Error 21.56 9.17 -0.27 0.09 0.05 0.01 -10.69 4.64 3.75 2.19 tStat 2.35 -2.89 7.41 -2.30 1.71 P-value 0.02 0.01 5.00E-09 0.03 0.09 Lower 9596 3.03 -0.46 0.04 -20.07 -0.68 Upper 9596 40.09 -0.08 0.06 -1.30 8.18 Answer the following questions based on the Excel output. For fill-in-the-blank questions, write your final answer only (without intermediate steps). Question 24 (4 points) For the sample data, the percentage of variation in prices that can be explained by the estimated regression equation equals 90% Quesuun 24 (4 points) For the sample data, the percentage of variation in prices that can be explained by the estimated regression equation equals 90% 95% 79% 81% Question 25 (4 points) For houses with a given square footage and number of bedrooms, if the number of rooms stays the same, then for every one-year older in the age of the house, the average price is expected to drop by $ Use 2-decimal accuracy for the final answer, e.g., 0.12, when necessary. Question 26 (4 points) The descriptive statistics of the data is given below: PRICE AGE SIZE BEDROOMS ROOMS Mean 75.72 31.91 1,498.60 2.93 6.22 Median 71.00 26 1,486 3 6 Minimum 34.00 9 416 1 3 Maximum 152.50 102 3,600 5 10 Consider a house in the neighborhood that is 10 years old and has 2,000 square feet, 4 bedrooms, and 8 rooms. The predicted selling price of this house = $ A .Use 2-decimal accuracy for the final answer, e.g., 0.12, when necessary. Consider a house in the neighborhood that is 10 years old and has 2,000 square feet, 4 bedrooms, and 8 rooms. The predicted selling price of this house = $ A Use 2-decimal accuracy for the final answer, e.g., 0.12, when necessary. Test whether there is a linear relationship between the price (PRICE) and the number of rooms (ROOMS). Use the level of significance a = 0.05. Complete the procedure below for the hypothesis testing. Question 27 (4 points) The null hypothesis can be written as OB4 = 0 OB3=0 B2 = 0 Question 28 (4 points) Ain) should be used for the hypothesis testing. Ottest O a test Ftest Z test Question 29 (4 points) The value of the test statistic = 2-decimal accuracy for the final answer, e.g., 0.12, when necessary. A .Use Question 30 (4 points) The p-value for the test = decimal accuracy for the final answer, e.g., 0.12, when necessary. Use 2- Question 31 (4 points) Based on the p-value, we at the given level of significance. reject Ho do not reject Ho cannot tell whether Ho should be rejected or not; more information is needed Question 32 (4 points) Based on the sample data, there is sufficient evidence that a linear relationship between PRICE and ROOMS