Answered step by step
Verified Expert Solution
Question
1 Approved Answer
A researcher examining the topic of juvenile delinquency is interested in investigating the average age of first contact with a disciplinary force (measured by school
- A researcher examining the topic of juvenile delinquency is interested in investigating the average age of first contact with a disciplinary force (measured by school suspensions). Based on a random sample of 185 students from a school district, she calculates a sample mean of 13.6 years and a sample standard deviation of 1.2 years.
- Based on ?=0.01, calculate the resulting confidence interval for this data set.
- Based on ?=0.05, calculate the resulting confidence interval for this data set.
- Interpret the two confidence intervals in your own words, to demonstrate understanding of the use of confidence intervals. Make sure to apply them to the specific research question that was asked.
- You are reading a newspaper article that claims a new crime prevention program is effective. The researchers state that as a result of the program, there was a mean reduction of 1.69 robberies per month across the cities included in the sample. To support their conclusion, they report a 95% confidence interval of -1.81 ?? 5.19 (i.e., 1.69 3.50) for the mean reduction in robberies. Do you agree with the researchers' claim that this program was effective? Fully explain why or why not, using the confidence interval result provided.
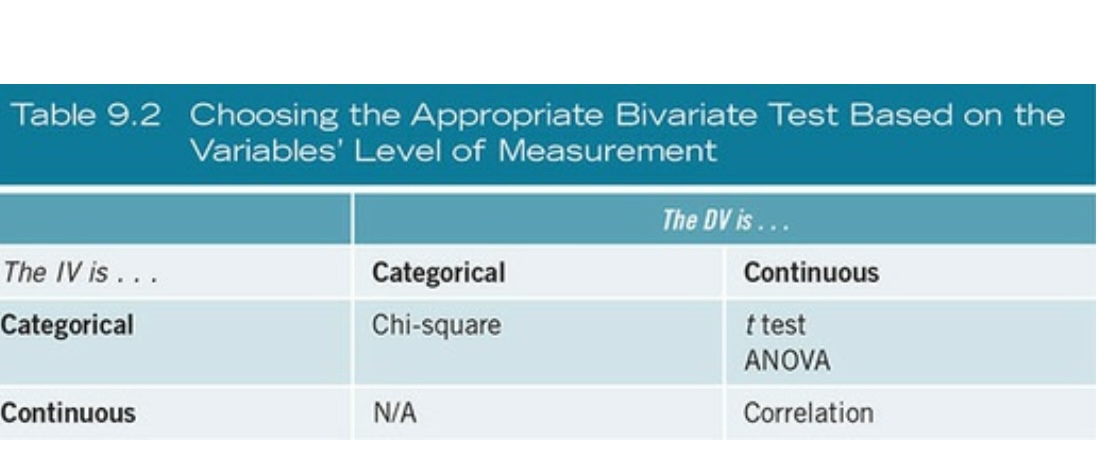
- A researcher is discussing results of a study of a new work release program. She compared a sample of paroled inmates who completed the program while they were incarcerated to a sample of parolees who did not. She found that 41% of the work release group was rearrested within one year of release, compared to 48% of the non-work release group. She asserts that this is strong proof that the program works. Do you agree with her conclusion, and why or why not? Prepare a response using the relevant concepts from the module, including the use of an appropriate statistical test contained in Table 9.2 (Chapter 9)of the textbook.

Step by Step Solution
There are 3 Steps involved in it
Step: 1

Get Instant Access to Expert-Tailored Solutions
See step-by-step solutions with expert insights and AI powered tools for academic success
Step: 2

Step: 3

Ace Your Homework with AI
Get the answers you need in no time with our AI-driven, step-by-step assistance
Get Started


