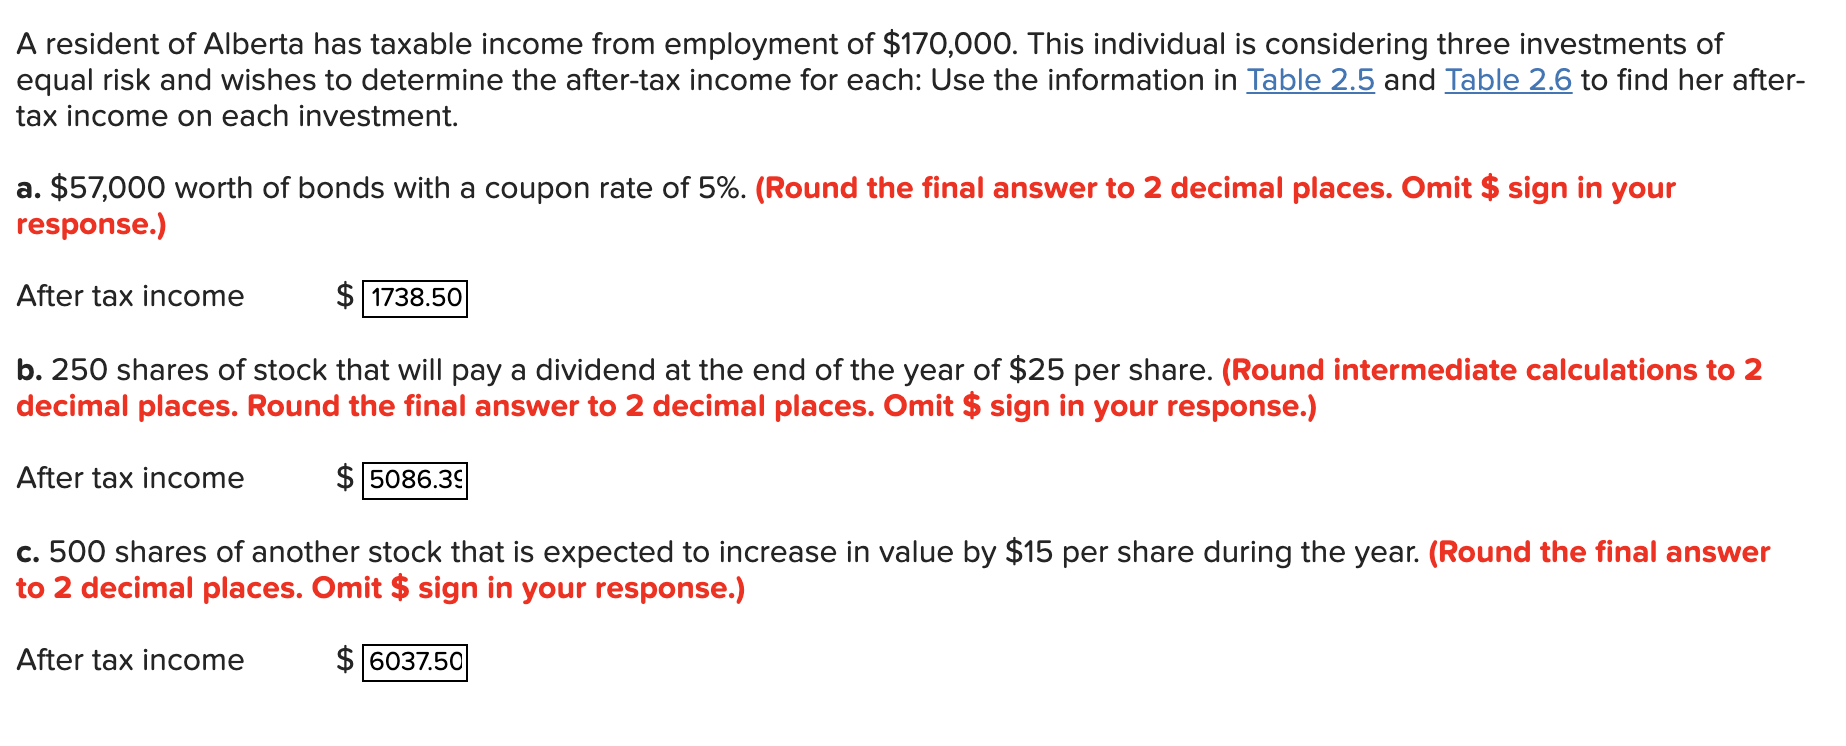
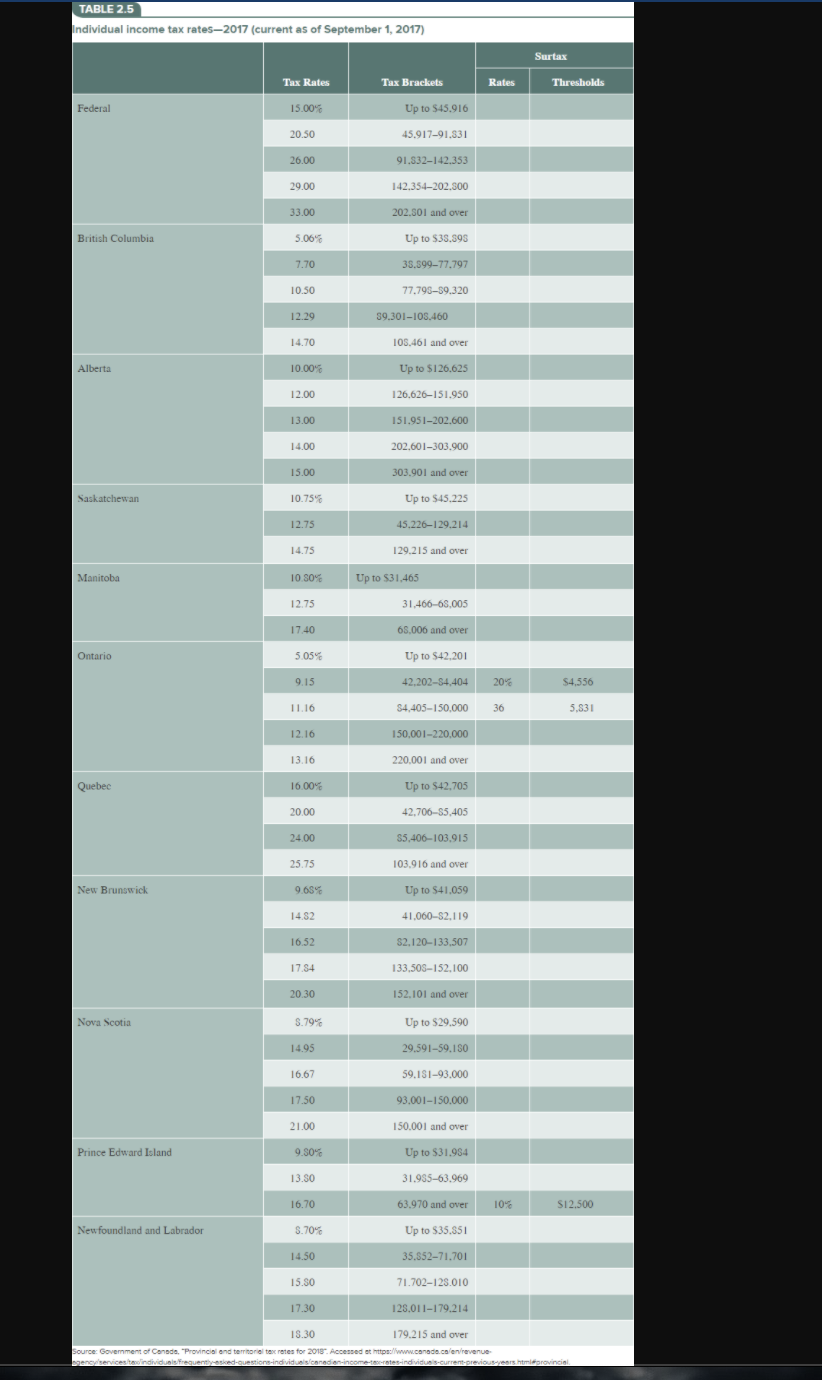
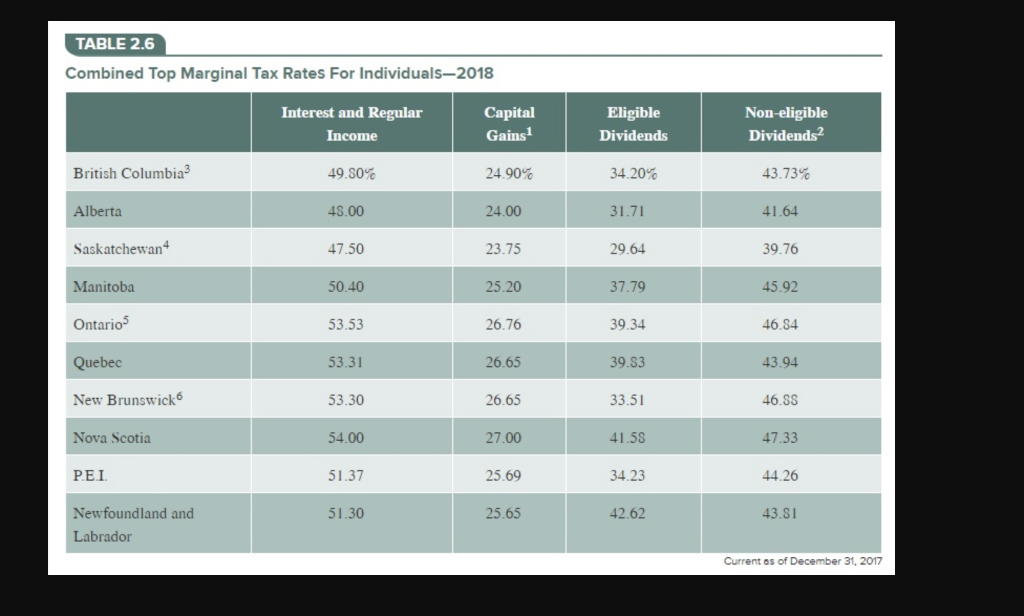
A resident of Alberta has taxable income from employment of $170,000. This individual is considering three investments of equal risk and wishes to determine the after-tax income for each: Use the information in Table 2.5 and Table 2.6 to find her after- tax income on each investment. a. $57,000 worth of bonds with a coupon rate of 5%. (Round the final answer to 2 decimal places. Omit $ sign in your response.) After tax income 1738.50 b. 250 shares of stock that will pay a dividend at the end of the year of $25 per share. (Round intermediate calculations to 2 decimal places. Round the final answer to 2 decimal places. Omit $ sign in your response.) After tax income $ 5086.39 c. 500 shares of another stock that is expected to increase in value by $15 per share during the year. (Round the final answer to 2 decimal places. Omit $ sign in your response.) After tax income $ 6037.50 TABLE 2.5 Individual income tax rates-2017 (current as of September 1, 2017) Surtax Thresholds Rates Tax Rates 15.00% Tax Brackets Up to $45.916 Federal 20.50 45.917-91.831 26.00 91.832-142.353 29.00 142.354-202.500 202.901 and over 33.00 5.06% British Columbia Up to $35.89S 7.70 35.59977.797 10.50 77.793-59.320 12.29 59.301-105.460 14.70 108.461 and over Up to $126.625 Alberta 10.000 12.00 126.626-151.950 13.00 151.951-202.600 14.00 202.601-303.900 15.00 303.901 and over Saskatchewan 10.75% Up to $45.225 12.75 45.226-129.214 14.75 129.215 and over Manitoba 10 80% Up to $31,465 12.75 31,466-68,005 65,006 and over 17.40 Ontario 5.05% Up to $42.201 9.15 42,202-84,404 20% $4.556 11.16 $4,405-150.000 36 5.831 12.16 150,001-220,000 13.16 220.001 and over Quebec 16.00% Up to $42,705 20.00 42.706-55.405 24.00 $5,406-103,915 25.75 103.916 and over New Brunswick 9.68% Up to $41,059 14.82 41.060-S2.119 16.52 S2.120-133.507 17.94 133,508-152.100 20.30 152.101 and over Nova Scotia 5.79% Up to $29.590 14.95 29.591-59,150 16.67 59.181-93.000 17.50 93.001-150.000 21.00 150.001 and over Prince Edward Island 9.50 Up to $31.954 13.50 31.955-63.969 16.70 63.970 and over 10 S12.500 Newfoundland and Labrador 5.70% Up to $35.851 14.50 35.552-71,701 15.30 71.702-125.010 17.30 125.011-179.214 18.30 179.215 and over Source: Government of Canada. "Provincial and territorie te retes for 2018. Accessed at https://www.canada.ca/en/revenue bgency services individuals Frequently asked questions individuals canadian-income-te-rates-individusis-current.previous years.htmrovincial TABLE 2.6 Combined Top Marginal Tax Rates For Individuals-2018 Interest and Regular Income Capital Gainsi Eligible Dividends Non-eligible Dividends2 British Columbia 49.50% 24.90% 34.20% 43.73% Alberta 48.00 24.00 31.71 41.64 Saskatchewan 47.50 23.75 29.64 39.76 Manitoba 50.40 25.20 37.79 45.92 Ontarios 53.53 26.76 39.34 46.84 Quebec 53.31 26.65 39.33 43.94 New Brunswick 53.30 26.65 33.51 46.SS Nova Scotia 54.00 27.00 41.58 47.33 PEI 51.37 25.69 34.23 44.26 51.30 25.65 42.62 43.81 Newfoundland and Labrador Current as of December 31, 2017