

Answered step by step
Verified Expert Solution
Question
1 Approved Answer
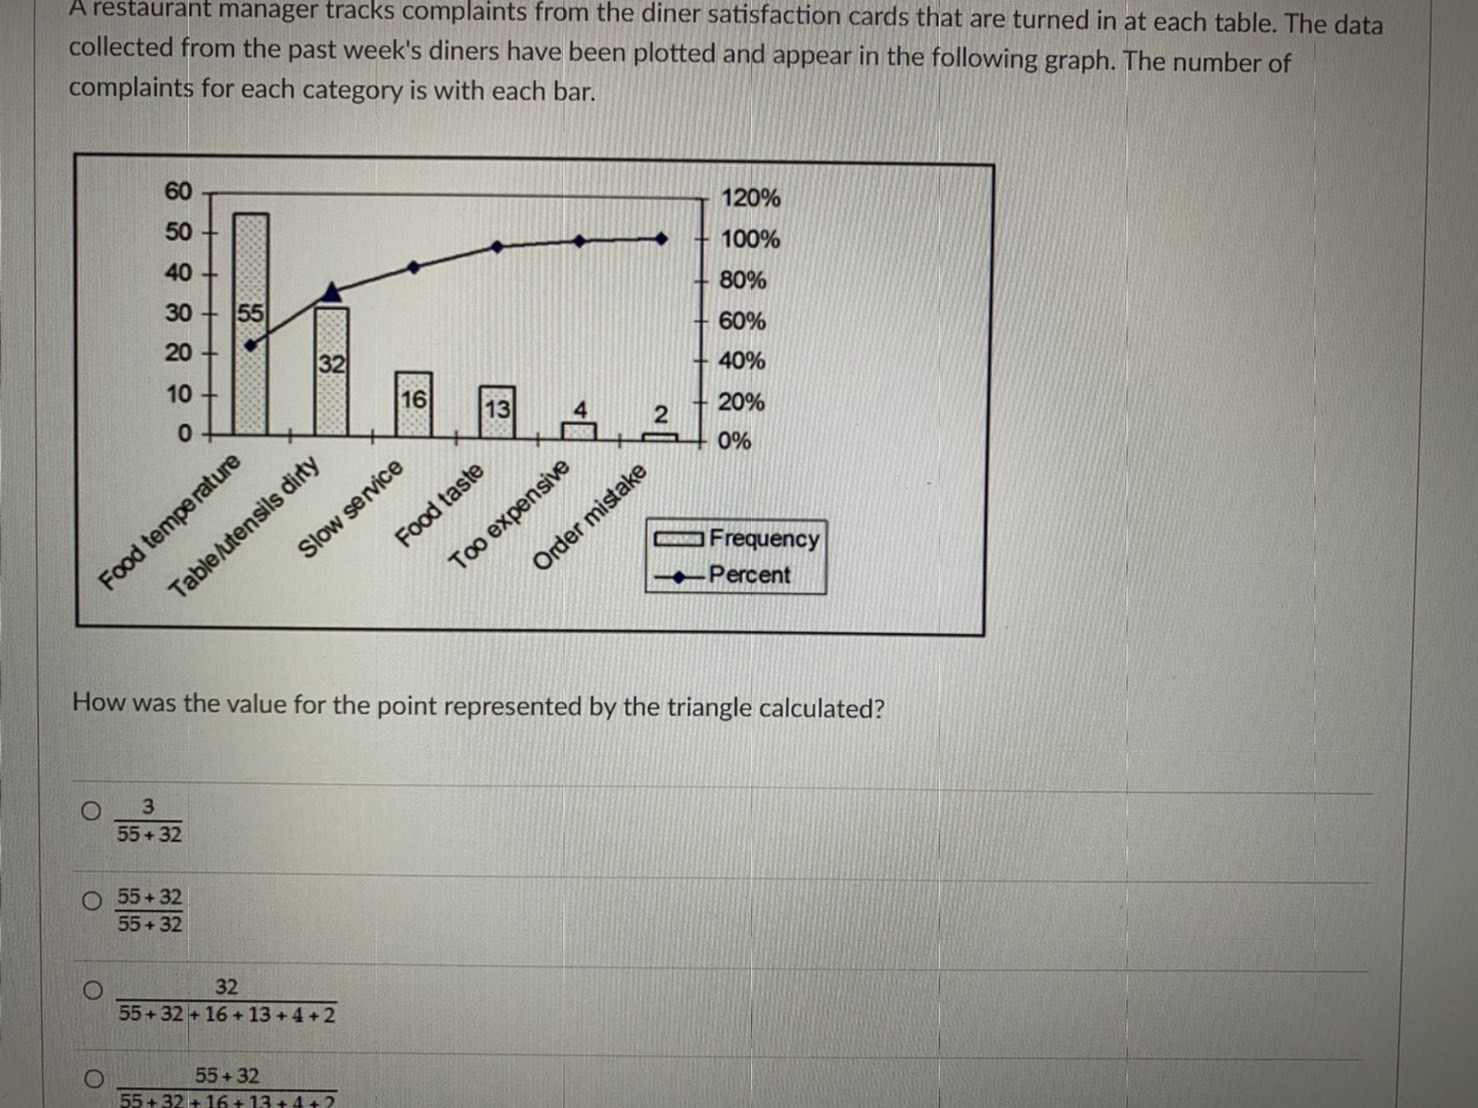
A restaurant manager tracks complaints from the diner satisfaction cards that are turned in at each table. The data collected from the past week's diners
Step by Step Solution
There are 3 Steps involved in it
Step: 1

Get Instant Access to Expert-Tailored Solutions
See step-by-step solutions with expert insights and AI powered tools for academic success
Step: 2

Step: 3
Ace Your Homework with AI
Get the answers you need in no time with our AI-driven, step-by-step assistance
Get Started
Managerial Accounting
Authors: Ray H. Garrison, Eric W. Noreen, Peter C. Brewer
12th Edition
978-0073526706, 9780073526706