Answered step by step
Verified Expert Solution
Question
1 Approved Answer
A restaurant wants to forecast its weekly sales. Historical data (in dollars) for fifteen weeks are shown below. Use Excel and the Moving Average
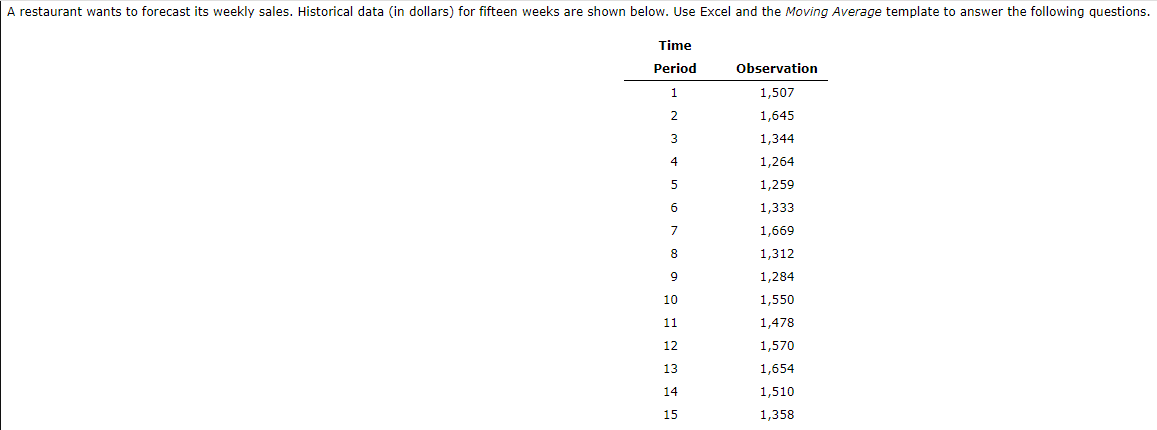
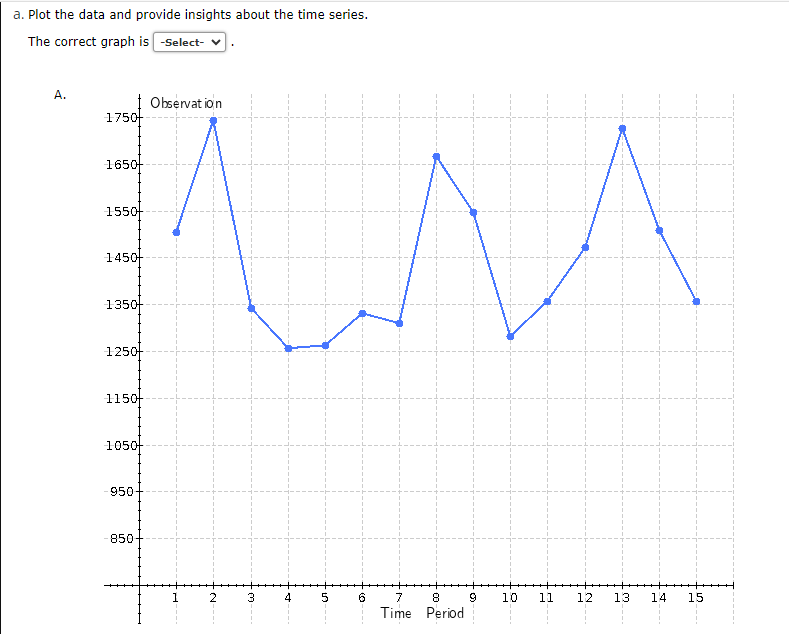
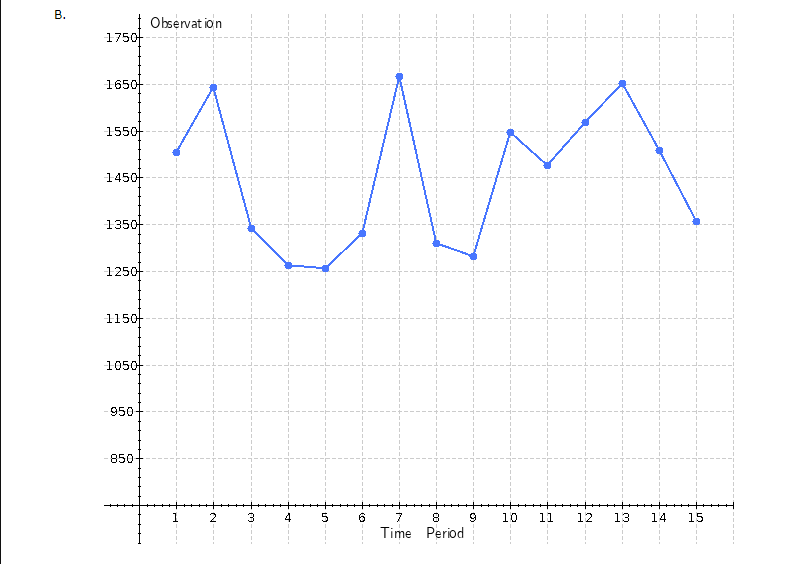
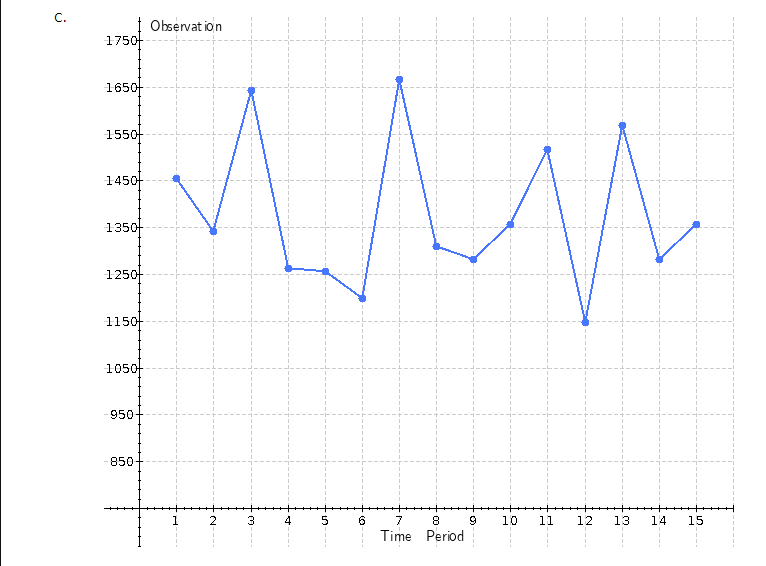
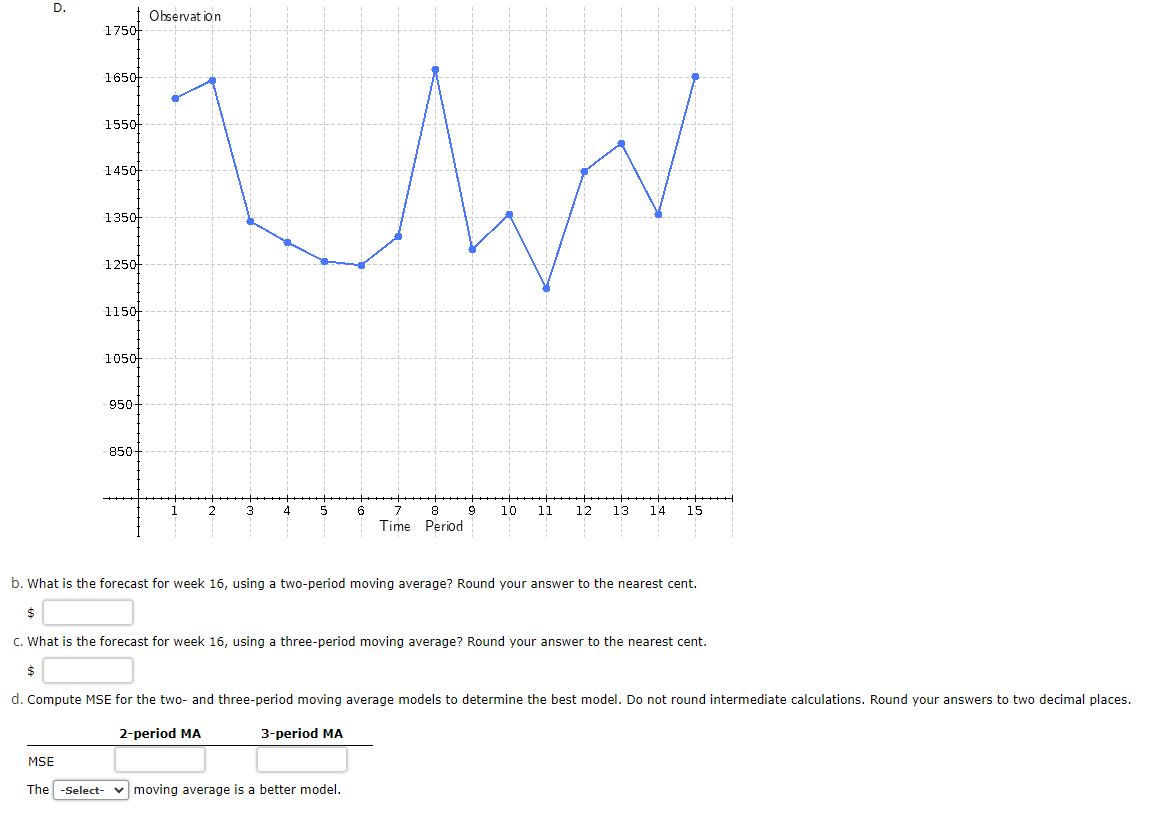
A restaurant wants to forecast its weekly sales. Historical data (in dollars) for fifteen weeks are shown below. Use Excel and the Moving Average template to answer the following questions. Time Period Observation 1 1,507 2 1,645 3 1,344 4 1,264 5 1,259 6 1,333 7 1,669 8 1,312 9 1,284 10 1,550 11 1,478 12 1,570 13 1,654 14 1,510 15 1,358 a. Plot the data and provide insights about the time series. The correct graph is -Select- A. 1750 1650 1550 1450 1350 1250 Observation 1150 1050- 950- 850 2 3 4 5 6 7 8 9 10 11 12 13 14 15 Time Period B. 1750 1650 1550+ 1450 1350 1250 Observation 1150 1050- 950- 850 2 3 4 5 6 7 8 Time Period 9 10 11 12 13 14 15 . 1750 1650 1550 1450 1350+ 1250 1150 Observation 1050 950 850 1 2 3 4 5 6 7 8 9 10 11 12 13 14 15 Time Period D. 1750 1650- 1550 1450 1350 1250 Observation AMW 1150 1050 950 850 3 4 5 7 8 9 10 11 12 13 14 15 Time Period b. What is the forecast for week 16, using a two-period moving average? Round your answer to the nearest cent. $ c. What is the forecast for week 16, using a three-period moving average? Round your answer to the nearest cent. $ d. Compute MSE for the two- and three-period moving average models to determine the best model. Do not round intermediate calculations. Round your answers to two decimal places. 3-period MA 2-period MA MSE The -Select- moving average is a better model.
Step by Step Solution
There are 3 Steps involved in it
Step: 1

Get Instant Access to Expert-Tailored Solutions
See step-by-step solutions with expert insights and AI powered tools for academic success
Step: 2

Step: 3

Ace Your Homework with AI
Get the answers you need in no time with our AI-driven, step-by-step assistance
Get Started


