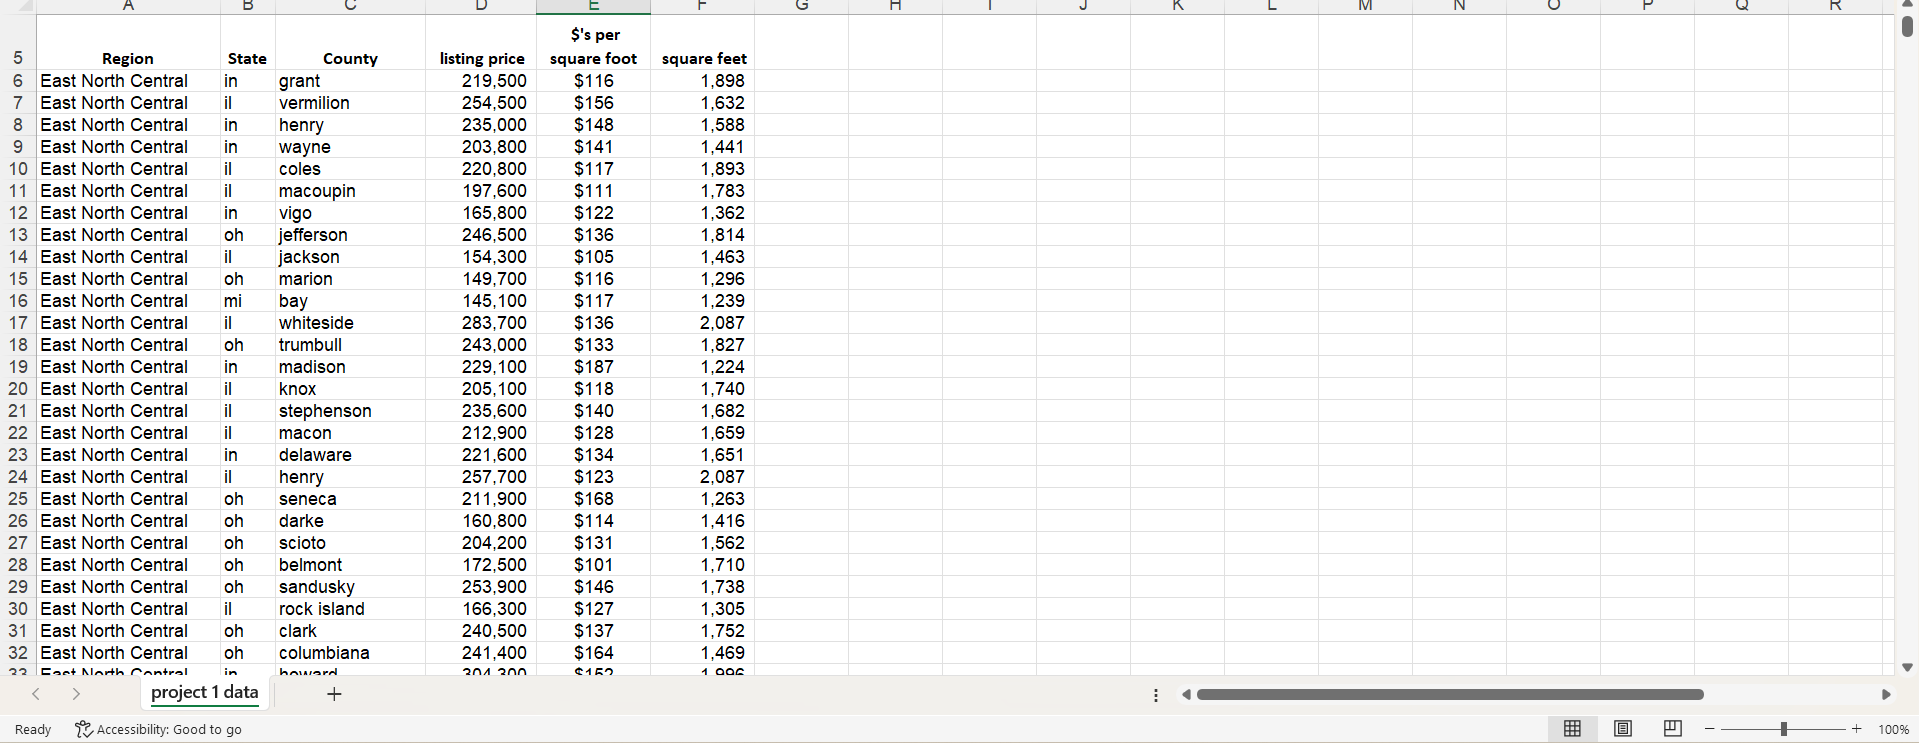
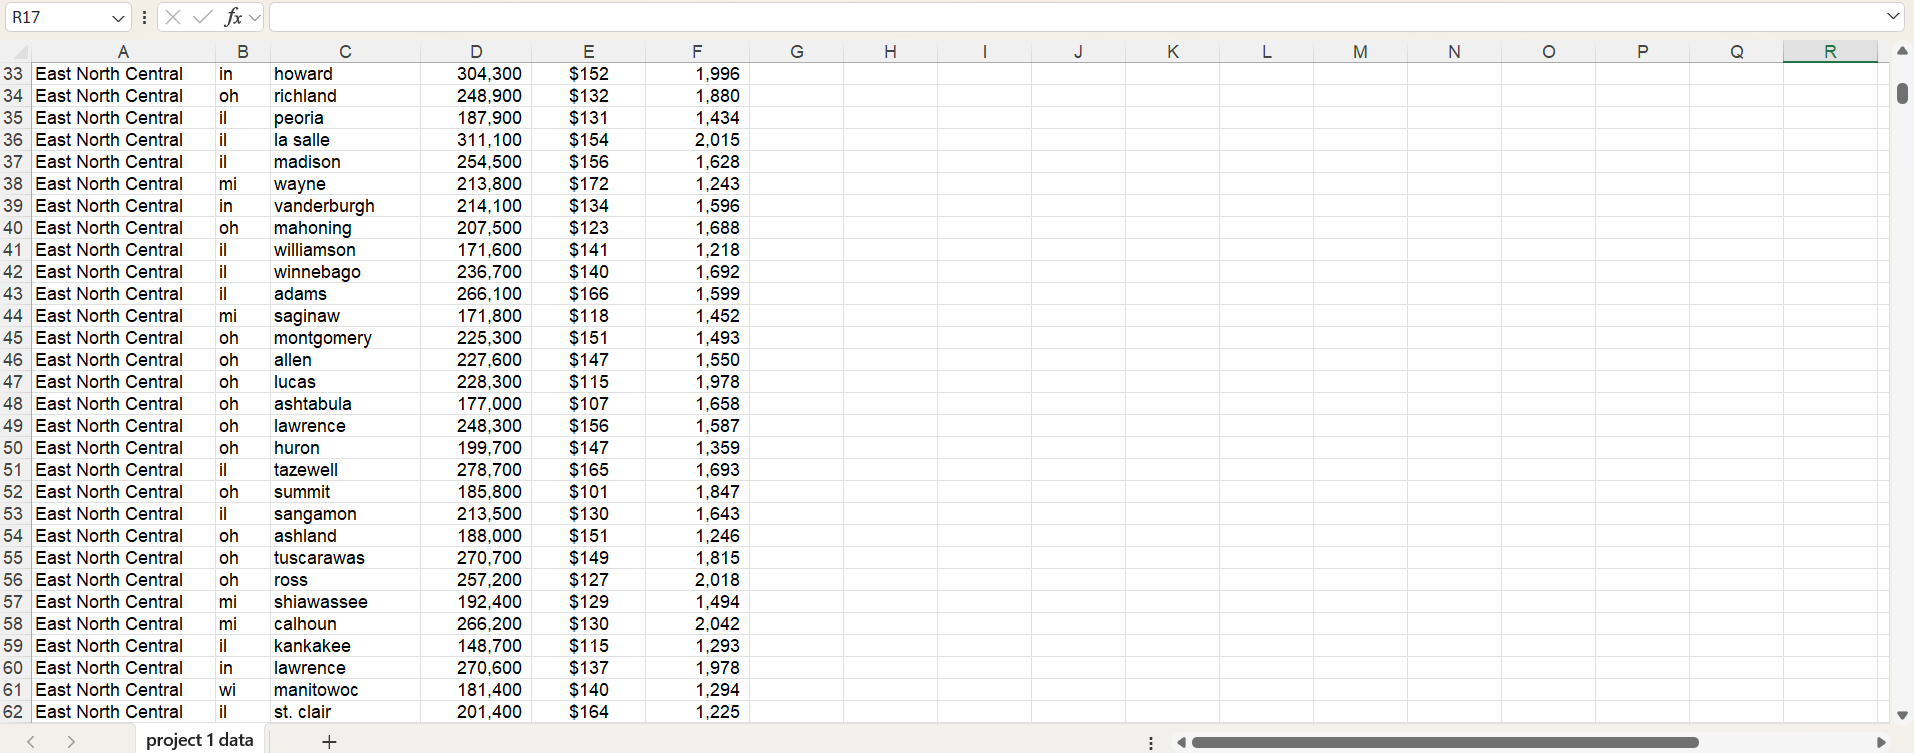
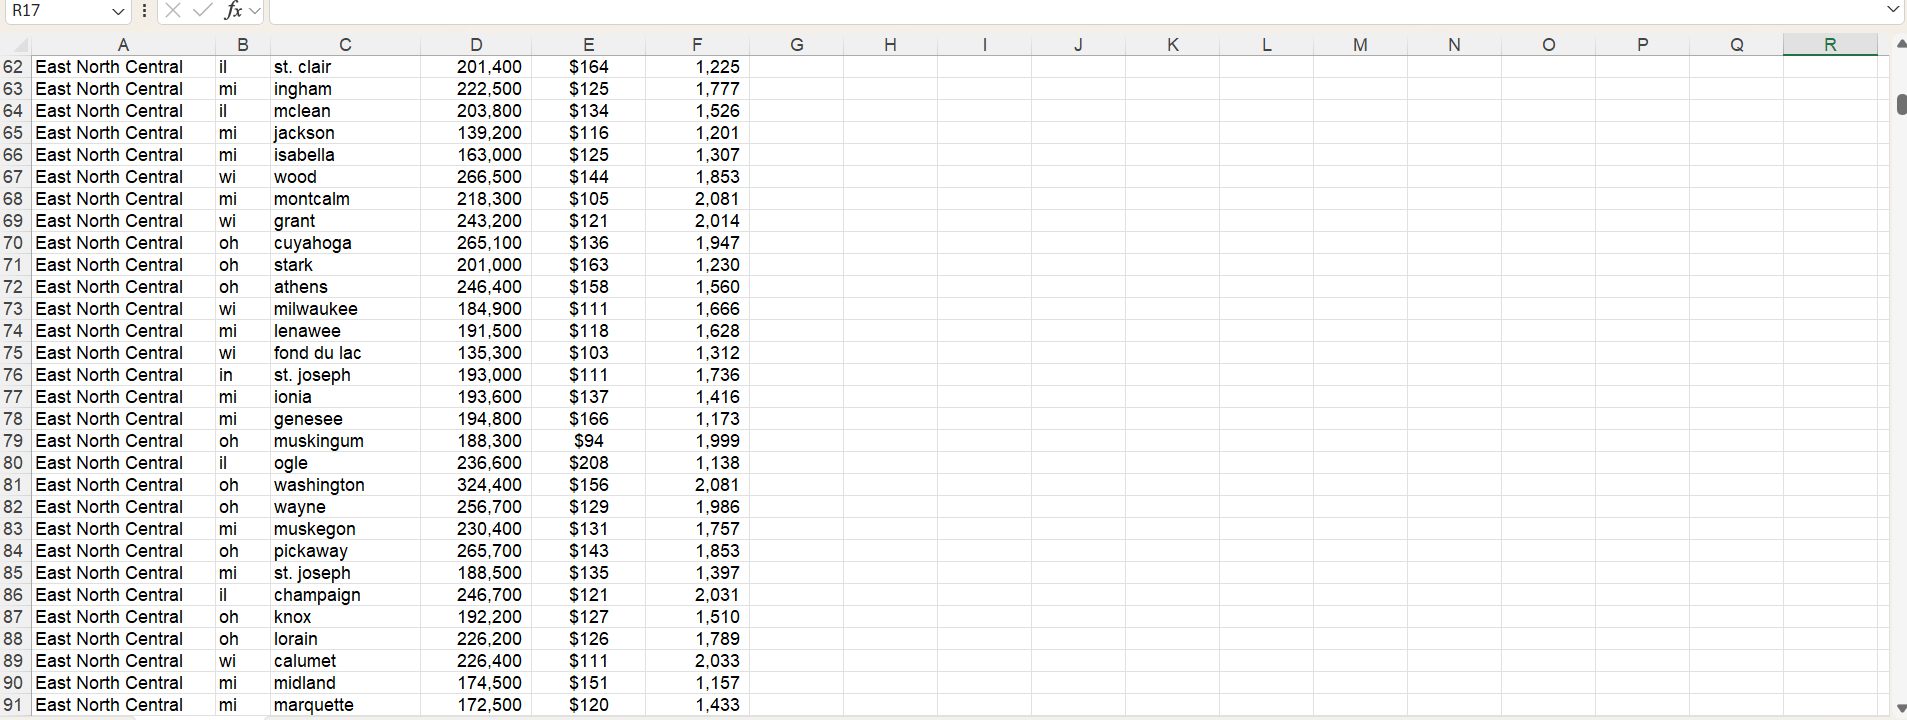
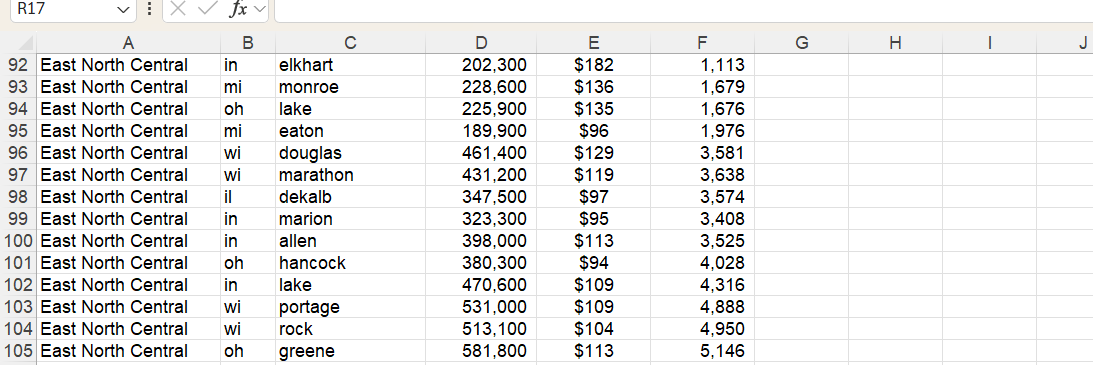
A sales team has asked you to prepare a report that examines the relationship between the selling price of properties and their size in square feet. Below is a Real Estate Data Spreadsheet spreadsheet that includes properties sold nationwide in recent years. Select a region, complete an initial analysis, and provide the report to the team. In the report, the response variable (y) should be the listing price and the predictor variable (x) should be the square feet.
- Generate a Representative Sample of the Data
- Select a region and generate a simple random sample of 30 from the data.
- Report the mean, median, and standard deviation of the listing price and the square foot variables.
- Analyze Your Sample
- Discuss how the regional sample created is or is not reflective of the national market.
- Compare and contrast your sample with the population using the National Summary Statistics and Graphs Real Estate Data PDF document.
- Explain how you have made sure that the sample is random.
- Explain your methods to get a truly random sample.
- Generate Scatterplot
- Create a scatterplot of the x and y variables noted above. Include a trend line and the regression equation. Label the axes.
- Observe patterns
- Answer the following questions based on the scatterplot:
- Define x and y. Which variable is useful for making predictions?
- Is there an association between x and y? Describe the association you see in the scatter plot.
- What do you see as the shape (linear or nonlinear)?
- If you had a 1,800 square foot house, based on the regression equation in the graph, what price would you choose to list at?
- Do you see any potential outliers in the scatterplot?
- Why do you think the outliers appeared in the scatterplot you generated?
$'s per Region State County listing price square foot square feet East North Central in grant 219,500 $116 1,898 East North Central il vermilion 254,500 $156 1,632 East North Central in henry 235,000 $148 1,588 1 00 East North Central in wayne 203,800 $141 1,441 10 East North Central coles 220,800 $117 1,893 11 East North Central macoupin 197,600 $111 1,783 12 East North Central in vigo 165,800 $122 1,362 13 East North Central oh jefferson 246,500 $136 1,814 14 East North Central il jackson 154,300 $105 1,463 15 East North Central oh marion 149,700 $1 16 1,296 16 East North Central mi bay 145, 100 $117 1,239 17 East North Central il whiteside 283,700 $136 2,087 18 East North Central oh trumbull 243,000 $133 1,827 19 East North Central in madison 229, 100 $187 1,224 20 East North Central knox 205, 100 $118 1,740 21 East North Central stephenson 235,600 $140 1,682 22 East North Central macon 212,900 $128 1,659 23 East North Central in delaware 221,600 $134 1,651 24 East North Central henry 257,700 $123 2,087 25 East North Central oh seneca 211,900 $168 1,263 26 East North Central oh dark 160,800 $114 1,416 27 East North Central oh scioto 204,200 $131 1,562 28 East North Central oh belmont 172,500 $101 1,710 29 East North Central oh sandusky 253,900 $146 1,738 30 East North Central rock island 166,300 $127 1,305 31 East North Central oh clark 240,500 $137 1,752 32 East North Central oh columbiana 241,400 $164 1,469 22 Fact North Control in 201 200 1 OOG project 1 data + Ready Accessibility: Good to go + 100%R17 viXVfxy A B C D E F G H J K L M N O P Q R 33 East North Central in howard 304,300 $152 1,996 34 East North Central oh richland 248,900 $132 1,880 35 East North Central peoria 187,900 $131 1,434 36 East North Central il a salle 311, 100 $154 2,015 37 East North Central il madison 254,500 $156 1,628 East North Central mi wayne 213,800 $172 1,243 East North Central in vanderburgh 214, 100 $134 1,596 40 East North Central oh mahoning 207,500 $123 1,688 41 East North Central il williamson 171,600 $141 1,218 42 East North Central winnebago 236,700 $140 1,692 43 East North Central il adams 266, 100 $166 1,599 44 East North Central mi saginaw 171,800 $118 1,452 45 East North Central oh montgomery 225,300 $151 1,493 46 East North Central oh allen 227,600 $147 1,550 47 East North Central oh lucas 228,300 $115 1,978 48 East North Central oh ashtabula 177,000 $107 1,658 49 East North Central oh lawrence 248,300 $156 1,587 50 East North Central oh huron 199,700 $147 1,359 51 East North Central il tazewell 278,700 $165 1,693 52 East North Central oh summit 185,800 $101 1,847 53 East North Central il sangamon 213,500 $130 1,643 54 East North Central oh ashland 188,000 $151 1,246 55 East North Central oh tuscarawas 270,700 $149 1,815 56 East North Central oh OSS 257,200 $127 2,018 57 East North Central mi shiawassee 192,400 $129 1,494 58 East North Central mi calhoun 266,200 $130 2,042 East North Central il kankakee 148,700 $115 1,293 East North Central in lawrence 270,600 $137 1,978 61 East North Central wi manitowoc 181,400 $140 1,294 62 East North Central st. clair 201,400 $164 1,225 project 1 dataR17 vi XV fxv A B C D E F G H I J K L M N O P 62 East North Central Q R st. clair 201,400 $164 1,225 63 East North Central mi ingham 222,500 $125 1,777 64 East North Central il mclean 203,800 $134 1,526 65 East North Central mi jackson 139,200 $116 1,201 66 East North Central mi isabella 163,000 $125 1,307 67 East North Central wi wood 266,500 $144 1,853 68 East North Central mi montcalm 218,300 $105 2,081 69 East North Central wi grant 243,200 $121 2,014 70 East North Central oh cuyahoga 265, 100 $136 1,947 71 East North Central oh stark 201,000 $163 1,230 72 East North Central oh athens 246,400 $158 1,560 73 East North Central wi milwaukee 184,900 $111 1,666 74 East North Central mi lenawee 191,500 $118 1,628 75 East North Central wi fond du lac 135,300 $103 1,312 76 East North Central in st. joseph 193,000 $111 1,736 77 East North Central mi ionia 193,600 $137 1,416 B East North Central mi genesee 194,800 $166 1,173 79 East North Central oh muskingum 188,300 $94 1,999 80 East North Central il ogle 236,600 $208 1, 138 81 East North Central oh washington 324,400 $156 2,081 82 East North Central oh wayne 256,700 $129 1,986 East North Central mi muskegon 230,400 $131 1,757 84 East North Central oh pickaway 265,700 $143 1,853 85 East North Central mi st. joseph 188,500 $135 1,397 86 East North Central il champaign 246,700 $121 2,031 87 East North Central oh knox 192,200 $127 1,510 88 East North Central oh lorain 226,200 $126 1,789 89 East North Central wi calumet 226,400 $111 2,033 90 East North Central mi midland 174,500 $151 1, 157 91 East North Central mi marquette 172,500 $120 1,433R17 V X V Jx v A B C D E F G H J 92 East North Central in elkhart 202,300 $182 1,113 93 East North Central mi monroe 228,600 $136 1,679 94 East North Central oh lake 225,900 $135 1,676 95 East North Central mi eaton 189,900 $96 1,976 96 East North Central wi douglas 461,400 $129 3,581 97 East North Central wi marathon 431,200 $119 3,638 98 East North Central il dekalb 347,500 $97 3,574 99 East North Central in marion 323,300 $95 3,408 100 East North Central in allen 398,000 $113 3,525 101 East North Central oh hancock 380,300 $94 4,028 102 East North Central in lake 470,600 $109 4,316 103 East North Central wi portage 531,000 $109 4.888 104 East North Central wi rock 513,100 $104 4,950 105 East North Central oh greene 581,800 $113 5,146


