

Question
A sales team has asked you to prepare report that examines the relationship between the selling price of properties and their size in square feet.
A sales team has asked you to prepare report that examines the relationship between the selling price of properties and their size in square feet. Below is a Real Estate Data Spreadsheet spreadsheet that includes properties sold nationwide in recent years. Select a region, do an initial analysis, and provide the report to the team. In the report, the response variable (y) should be the listing price and the predictor variable (x) should be the square feet.
- Generate a Representative Sample of the Data
- Select a region and generate a simple random sample of 30 from the data.
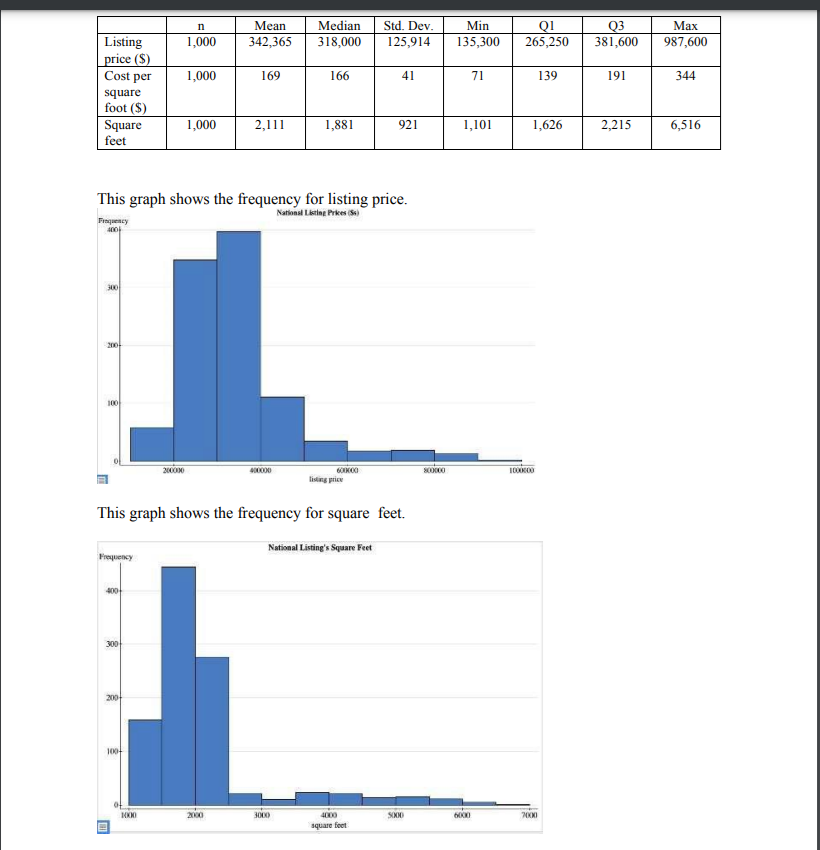
- Report the mean, median, and standard deviation of the listing price and the square foot variables.
- Analyze Your Sample
- Discuss how the regional sample created is or is not reflective of the national market.
- Compare and contrast your sample with the population using the National Summary Statistics and Graphs Real Estate Data PDF document.
- Explain how you have made sure that the sample is random.
- Explain your methods to get a truly random sample.
- Discuss how the regional sample created is or is not reflective of the national market.
- Generate Scatterplot
- make a scatterplot of the x and y variables noted above. Include a trend line and the regression equation. Label the axes.
- Observe patterns
- Answer the following questions based on the scatterplot:
- Define x and y. Which variable is useful for making predictions?
- Is there an association between x and y? Describe the association you see in the scatter plot.
- What do you see as the shape (linear or nonlinear)?
- If you had a 1,800 square foot house, based on the regression equation in the graph, what price would you choose to list at?
- Do you see any potential outliers in the scatterplot?
- Why do you think the outliers appeared in the scatterplot you generated?
- What do they represent
- Answer the following questions based on the scatterplot:
| Region | State | County | listing price | $'s per square foot | square feet |
| East North Central | in | grant | 219,500 | $116 | 1,898 |
| East North Central | il | vermilion | 254,500 | $156 | 1,632 |
| East North Central | in | henry | 235,000 | $148 | 1,588 |
| East North Central | in | wayne | 203,800 | $141 | 1,441 |
| East North Central | il | coles | 220,800 | $117 | 1,893 |
| East North Central | il | macoupin | 197,600 | $111 | 1,783 |
| East North Central | in | vigo | 165,800 | $122 | 1,362 |
| East North Central | oh | jefferson | 246,500 | $136 | 1,814 |
| East North Central | il | jackson | 154,300 | $105 | 1,463 |
| East North Central | oh | marion | 149,700 | $116 | 1,296 |
| East North Central | mi | bay | 145,100 | $117 | 1,239 |
| East North Central | il | whiteside | 283,700 | $136 | 2,087 |
| East North Central | oh | trumbull | 243,000 | $133 | 1,827 |
| East North Central | in | madison | 229,100 | $187 | 1,224 |
| East North Central | il | knox | 205,100 | $118 | 1,740 |
| East North Central | il | stephenson | 235,600 | $140 | 1,682 |
| East North Central | il | macon | 212,900 | $128 | 1,659 |
| East North Central | in | delaware | 221,600 | $134 | 1,651 |
| East North Central | il | henry | 257,700 | $123 | 2,087 |
| East North Central | oh | seneca | 211,900 | $168 | 1,263 |
| East North Central | oh | darke | 160,800 | $114 | 1,416 |
| East North Central | oh | scioto | 204,200 | $131 | 1,562 |
| East North Central | oh | belmont | 172,500 | $101 | 1,710 |
| East North Central | oh | sandusky | 253,900 | $146 | 1,738 |
| East North Central | il | rock island | 166,300 | $127 | 1,305 |
| East North Central | oh | clark | 240,500 | $137 | 1,752 |
| East North Central | oh | columbiana | 241,400 | $164 | 1,469 |
| East North Central | in | howard | 304,300 | $152 | 1,996 |
| East North Central | oh | richland | 248,900 | $132 | 1,880 |
| East North Central | il | peoria | 187,900 | $131 | 1,434 |
| East North Central | il | la salle | 311,100 | $154 | 2,015 |
| East North Central | il | madison | 254,500 | $156 | 1,628 |
| East North Central | mi | wayne | 213,800 | $172 | 1,243 |
| East North Central | in | vanderburgh | 214,100 | $134 | 1,596 |
| East North Central | oh | mahoning | 207,500 | $123 | 1,688 |
| East North Central | il | williamson | 171,600 | $141 | 1,218 |
| East North Central | il | winnebago | 236,700 | $140 | 1,692 |
| East North Central | il | adams | 266,100 | $166 | 1,599 |
| East North Central | mi | saginaw | 171,800 | $118 | 1,452 |
| East North Central | oh | montgomery | 225,300 | $151 | 1,493 |
| East North Central | oh | allen | 227,600 | $147 | 1,550 |
| East North Central | oh | lucas | 228,300 | $115 | 1,978 |
| East North Central | oh | ashtabula | 177,000 | $107 | 1,658 |
| East North Central | oh | lawrence | 248,300 | $156 | 1,587 |
| East North Central | oh | huron | 199,700 | $147 | 1,359 |
| East North Central | il | tazewell | 278,700 | $165 | 1,693 |
| East North Central | oh | summit | 185,800 | $101 | 1,847 |
| East North Central | il | sangamon | 213,500 | $130 | 1,643 |
| East North Central | oh | ashland | 188,000 | $151 | 1,246 |
| East North Central | oh | tuscarawas | 270,700 | $149 | 1,815 |
| East North Central | oh | ross | 257,200 | $127 | 2,018 |
| East North Central | mi | shiawassee | 192,400 | $129 | 1,494 |
| East North Central | mi | calhoun | 266,200 | $130 | 2,042 |
| East North Central | il | kankakee | 148,700 | $115 | 1,293 |
| East North Central | in | lawrence | 270,600 | $137 | 1,978 |
| East North Central | wi | manitowoc | 181,400 | $140 | 1,294 |
| East North Central | il | st. clair | 201,400 | $164 | 1,225 |
| East North Central | mi | ingham | 222,500 | $125 | 1,777 |
| East North Central | il | mclean | 203,800 | $134 | 1,526 |
| East North Central | mi | jackson | 139,200 | $116 | 1,201 |
| East North Central | mi | isabella | 163,000 | $125 | 1,307 |
| East North Central | wi | wood | 266,500 | $144 | 1,853 |
| East North Central | mi | montcalm | 218,300 | $105 | 2,081 |
| East North Central | wi | grant | 243,200 | $121 | 2,014 |
| East North Central | oh | cuyahoga | 265,100 | $136 | 1,947 |
| East North Central | oh | stark | 201,000 | $163 | 1,230 |
| East North Central | oh | athens | 246,400 | $158 | 1,560 |
| East North Central | wi | milwaukee | 184,900 | $111 | 1,666 |
| East North Central | mi | lenawee | 191,500 | $118 | 1,628 |
| East North Central | wi | fond du lac | 135,300 | $103 | 1,312 |
| East North Central | in | st. joseph | 193,000 | $111 | 1,736 |
| East North Central | mi | ionia | 193,600 | $137 | 1,416 |
| East North Central | mi | genesee | 194,800 | $166 | 1,173 |
| East North Central | oh | muskingum | 188,300 | $94 | 1,999 |
| East North Central | il | ogle | 236,600 | $208 | 1,138 |
| East North Central | oh | washington | 324,400 | $156 | 2,081 |
| East North Central | oh | wayne | 256,700 | $129 | 1,986 |
| East North Central | mi | muskegon | 230,400 | $131 | 1,757 |
| East North Central | oh | pickaway | 265,700 | $143 | 1,853 |
| East North Central | mi | st. joseph | 188,500 | $135 | 1,397 |
| East North Central | il | champaign | 246,700 | $121 | 2,031 |
| East North Central | oh | knox | 192,200 | $127 | 1,510 |
| East North Central | oh | lorain | 226,200 | $126 | 1,789 |
| East North Central | wi | calumet | 226,400 | $111 | 2,033 |
| East North Central | mi | midland | 174,500 | $151 | 1,157 |
| East North Central | mi | marquette | 172,500 | $120 | 1,433 |
| East North Central | in | elkhart | 202,300 | $182 | 1,113 |
| East North Central | mi | monroe | 228,600 | $136 | 1,679 |
| East North Central | oh | lake | 225,900 | $135 | 1,676 |
| East North Central | mi | eaton | 189,900 | $96 | 1,976 |
| East North Central | wi | douglas | 461,400 | $129 | 3,581 |
| East North Central | wi | marathon | 431,200 | $119 | 3,638 |
| East North Central | il | dekalb | 347,500 | $97 | 3,574 |
| East North Central | in | marion | 323,300 | $95 | 3,408 |
| East North Central | in | allen | 398,000 | $113 | 3,525 |
| East North Central | oh | hancock | 380,300 | $94 | 4,028 |
| East North Central | in | lake | 470,600 | $109 | 4,316 |
| East North Central | wi | portage | 531,000 | $109 | 4,888 |
| East North Central | wi | rock | 513,100 | $104 | 4,950 |
| East North Central | oh | greene | 581,800 | $113 | 5,146 |
Step by Step Solution
There are 3 Steps involved in it
Step: 1

Get Instant Access to Expert-Tailored Solutions
See step-by-step solutions with expert insights and AI powered tools for academic success
Step: 2

Step: 3
Ace Your Homework with AI
Get the answers you need in no time with our AI-driven, step-by-step assistance
Get Started
Essentials of Business Analytics
Authors: Jeffrey D. Camm, James J. Cochran, Michael J. Fry, Jeffrey W. Ohlmann, David R. Anderson
2nd edition
1305627733, 978-1305861817, 1305861817, 978-0357688960, 978-1305627734