Question
A sample of 100 call interarrival times (in seconds) at a call-center was collected for use in a simulation study. The summary information for

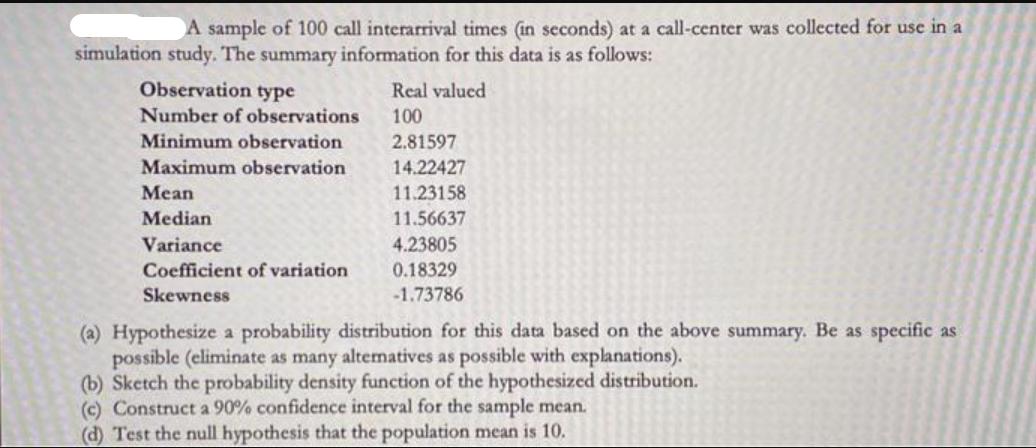
A sample of 100 call interarrival times (in seconds) at a call-center was collected for use in a simulation study. The summary information for this data is as follows: Observation type Number of observations Minimum observation Maximum observation Mean Median Variance Coefficient of variation Skewness Real valued 100 2.81597 14.22427 11.23158 11.56637 4.23805 0.18329 -1.73786 (a) Hypothesize a probability distribution for this data based on the above summary. Be as specific as possible (eliminate as many alternatives as possible with explanations). (b) Sketch the probability density function of the hypothesized distribution. (c) Construct a 90% confidence interval for the sample mean. (d) Test the null hypothesis that the population mean is 10.
Step by Step Solution
3.45 Rating (161 Votes )
There are 3 Steps involved in it
Step: 1

Get Instant Access to Expert-Tailored Solutions
See step-by-step solutions with expert insights and AI powered tools for academic success
Step: 2

Step: 3

Ace Your Homework with AI
Get the answers you need in no time with our AI-driven, step-by-step assistance
Get StartedRecommended Textbook for
Management Accounting Information for Decision-Making and Strategy Execution
Authors: Anthony A. Atkinson, Robert S. Kaplan, Ella Mae Matsumura, S. Mark Young
6th Edition
137024975, 978-0137024971
Students also viewed these Mathematics questions
Question
Answered: 1 week ago
Question
Answered: 1 week ago
Question
Answered: 1 week ago
Question
Answered: 1 week ago
Question
Answered: 1 week ago
Question
Answered: 1 week ago
Question
Answered: 1 week ago
Question
Answered: 1 week ago
Question
Answered: 1 week ago
Question
Answered: 1 week ago
Question
Answered: 1 week ago
Question
Answered: 1 week ago
Question
Answered: 1 week ago
Question
Answered: 1 week ago
Question
Answered: 1 week ago
Question
Answered: 1 week ago
Question
Answered: 1 week ago
Question
Answered: 1 week ago
Question
Answered: 1 week ago
Question
Answered: 1 week ago
Question
Answered: 1 week ago
View Answer in SolutionInn App


