A sample of blood pressure measurements is taken for a group of adults, and those values (mm Hg) are listed below. The values are matched
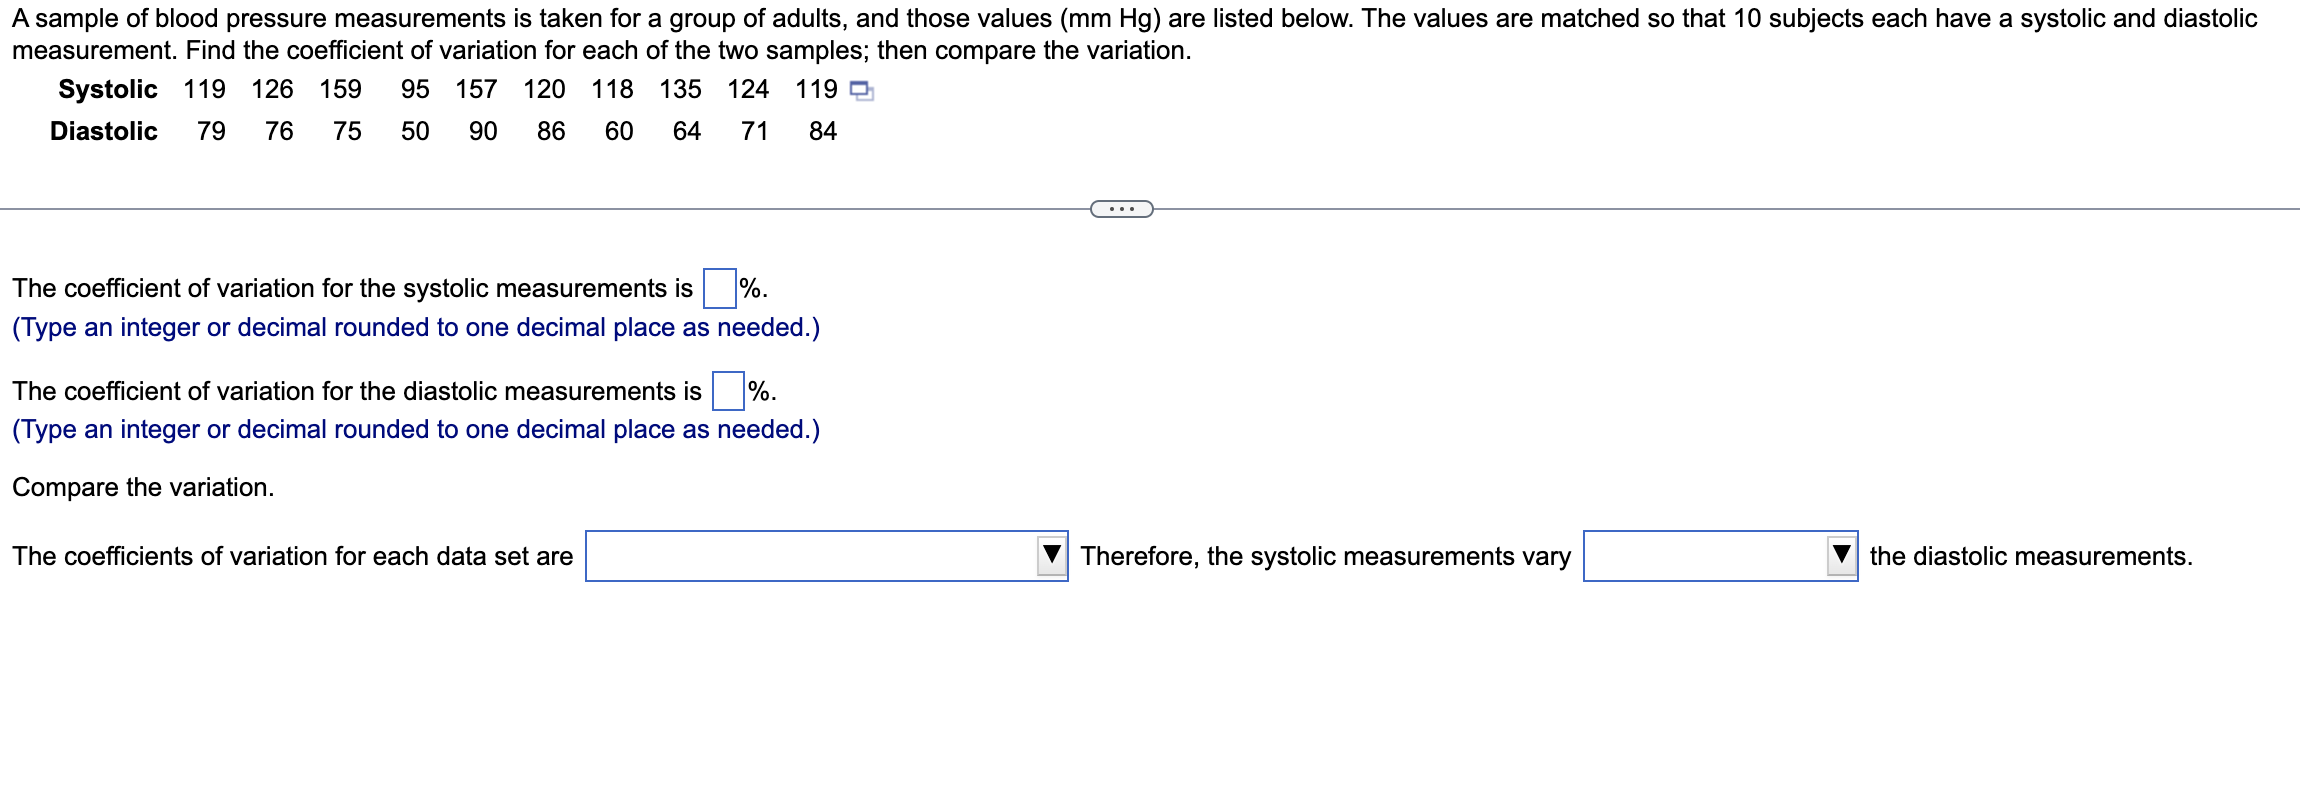
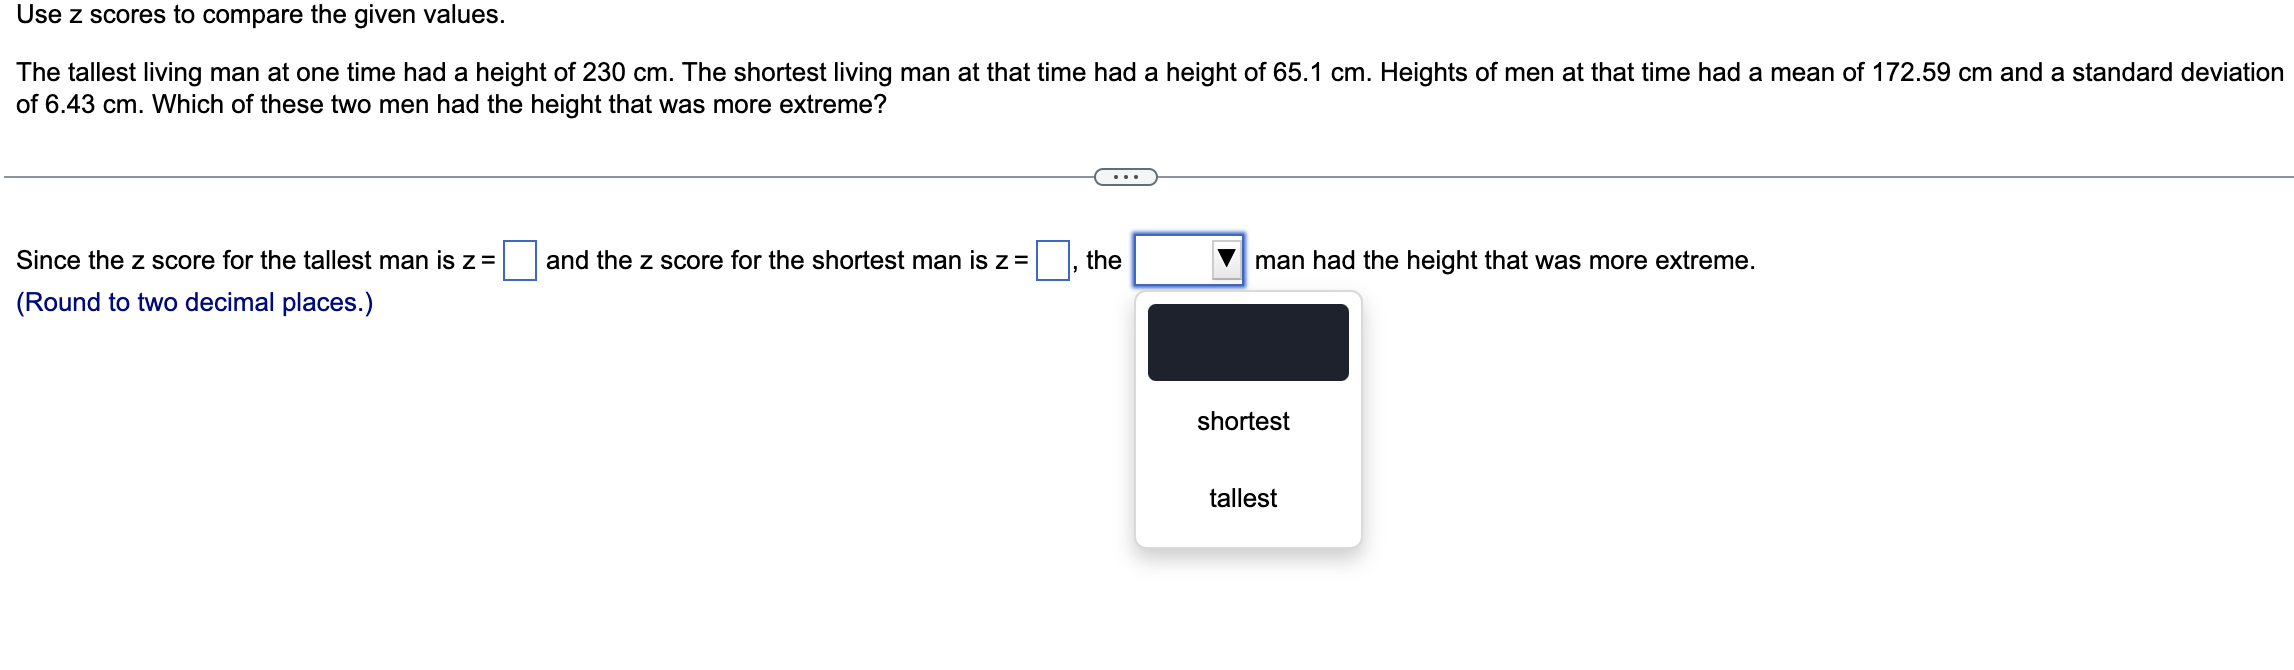
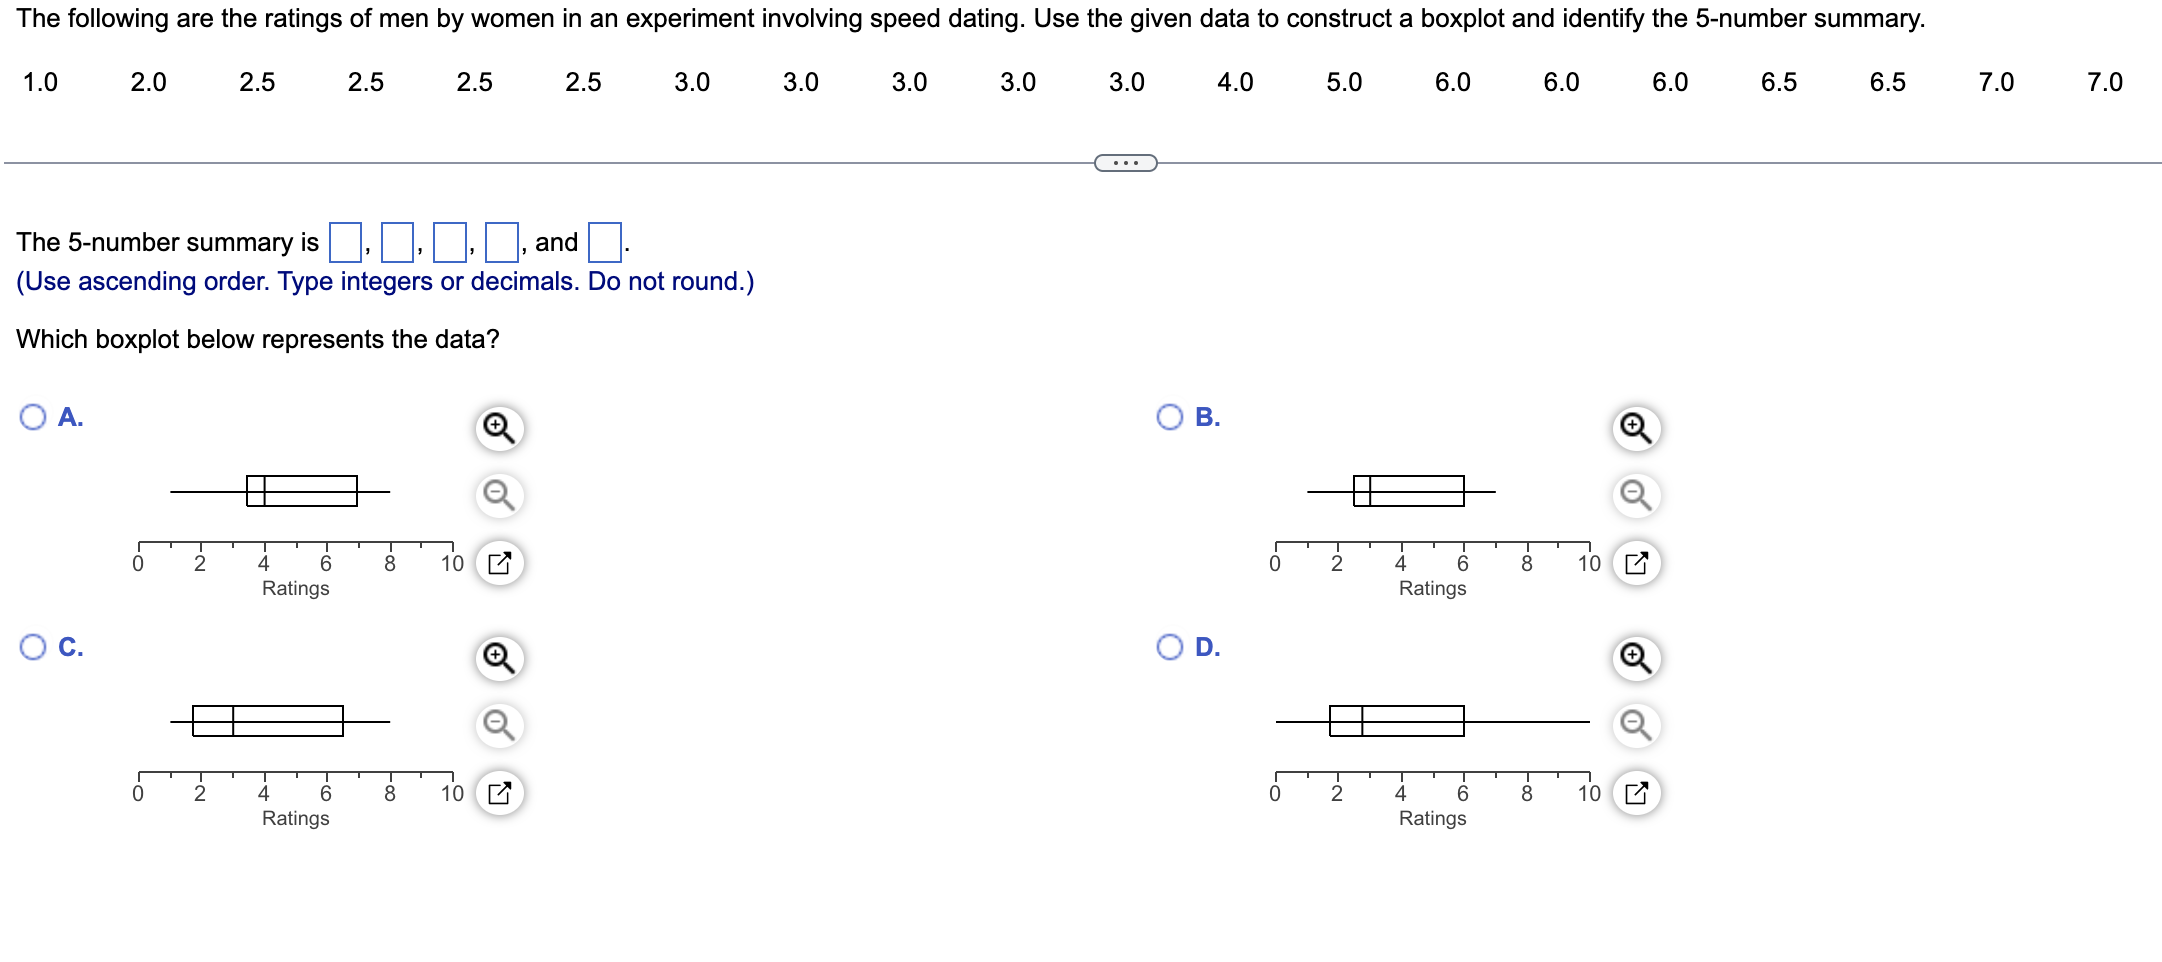
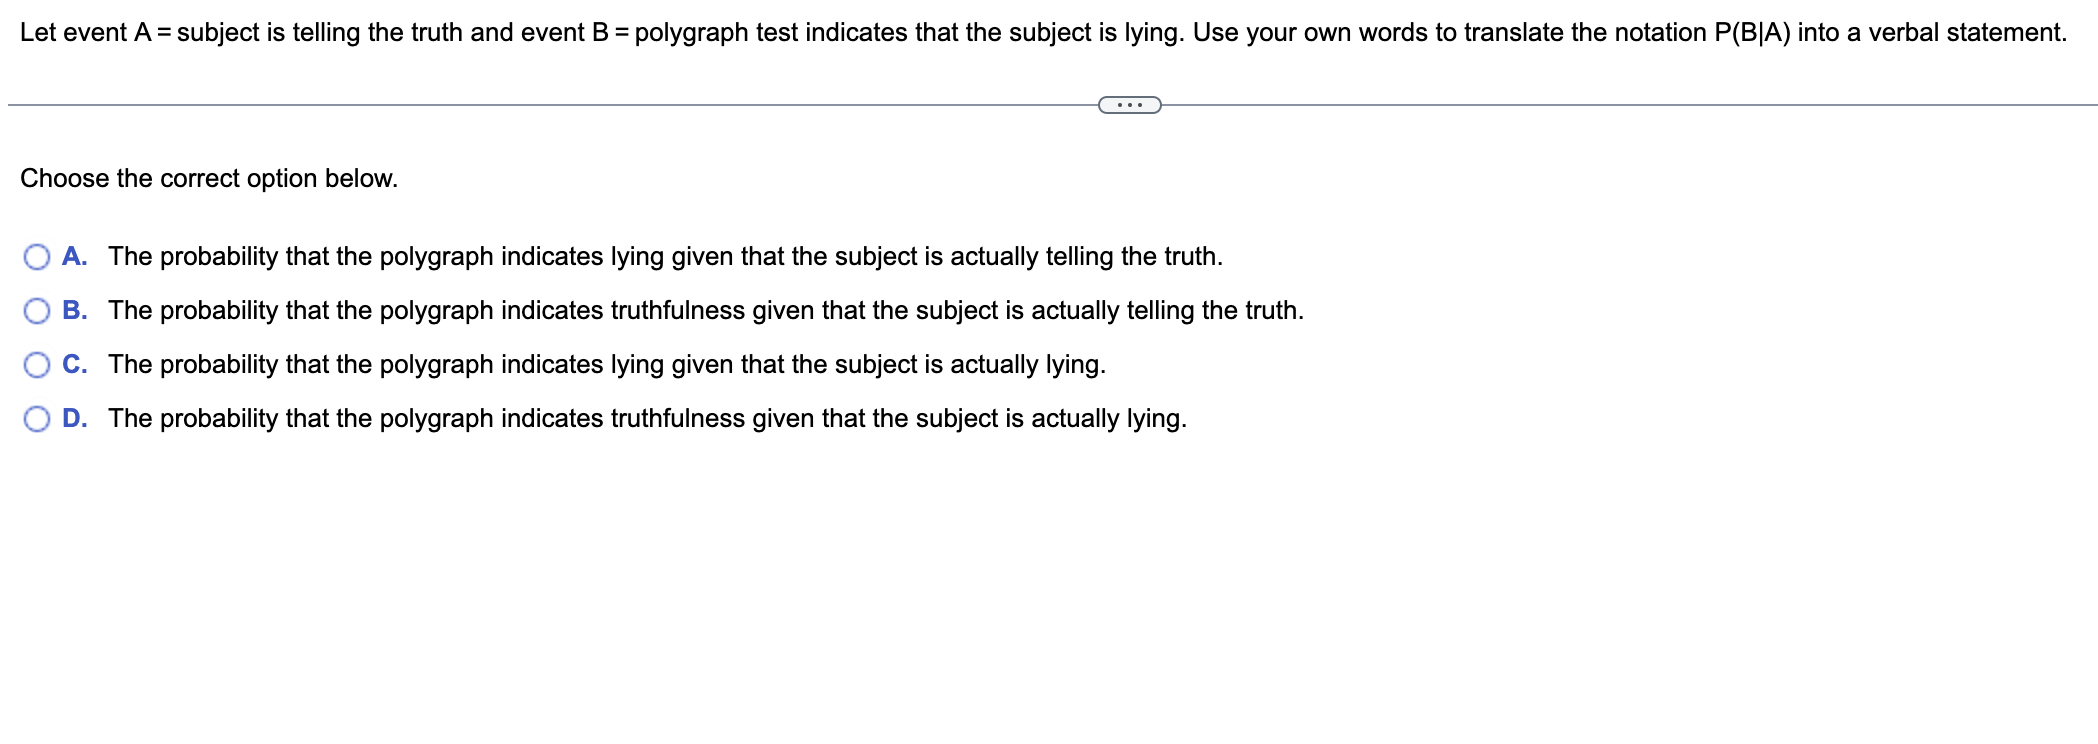
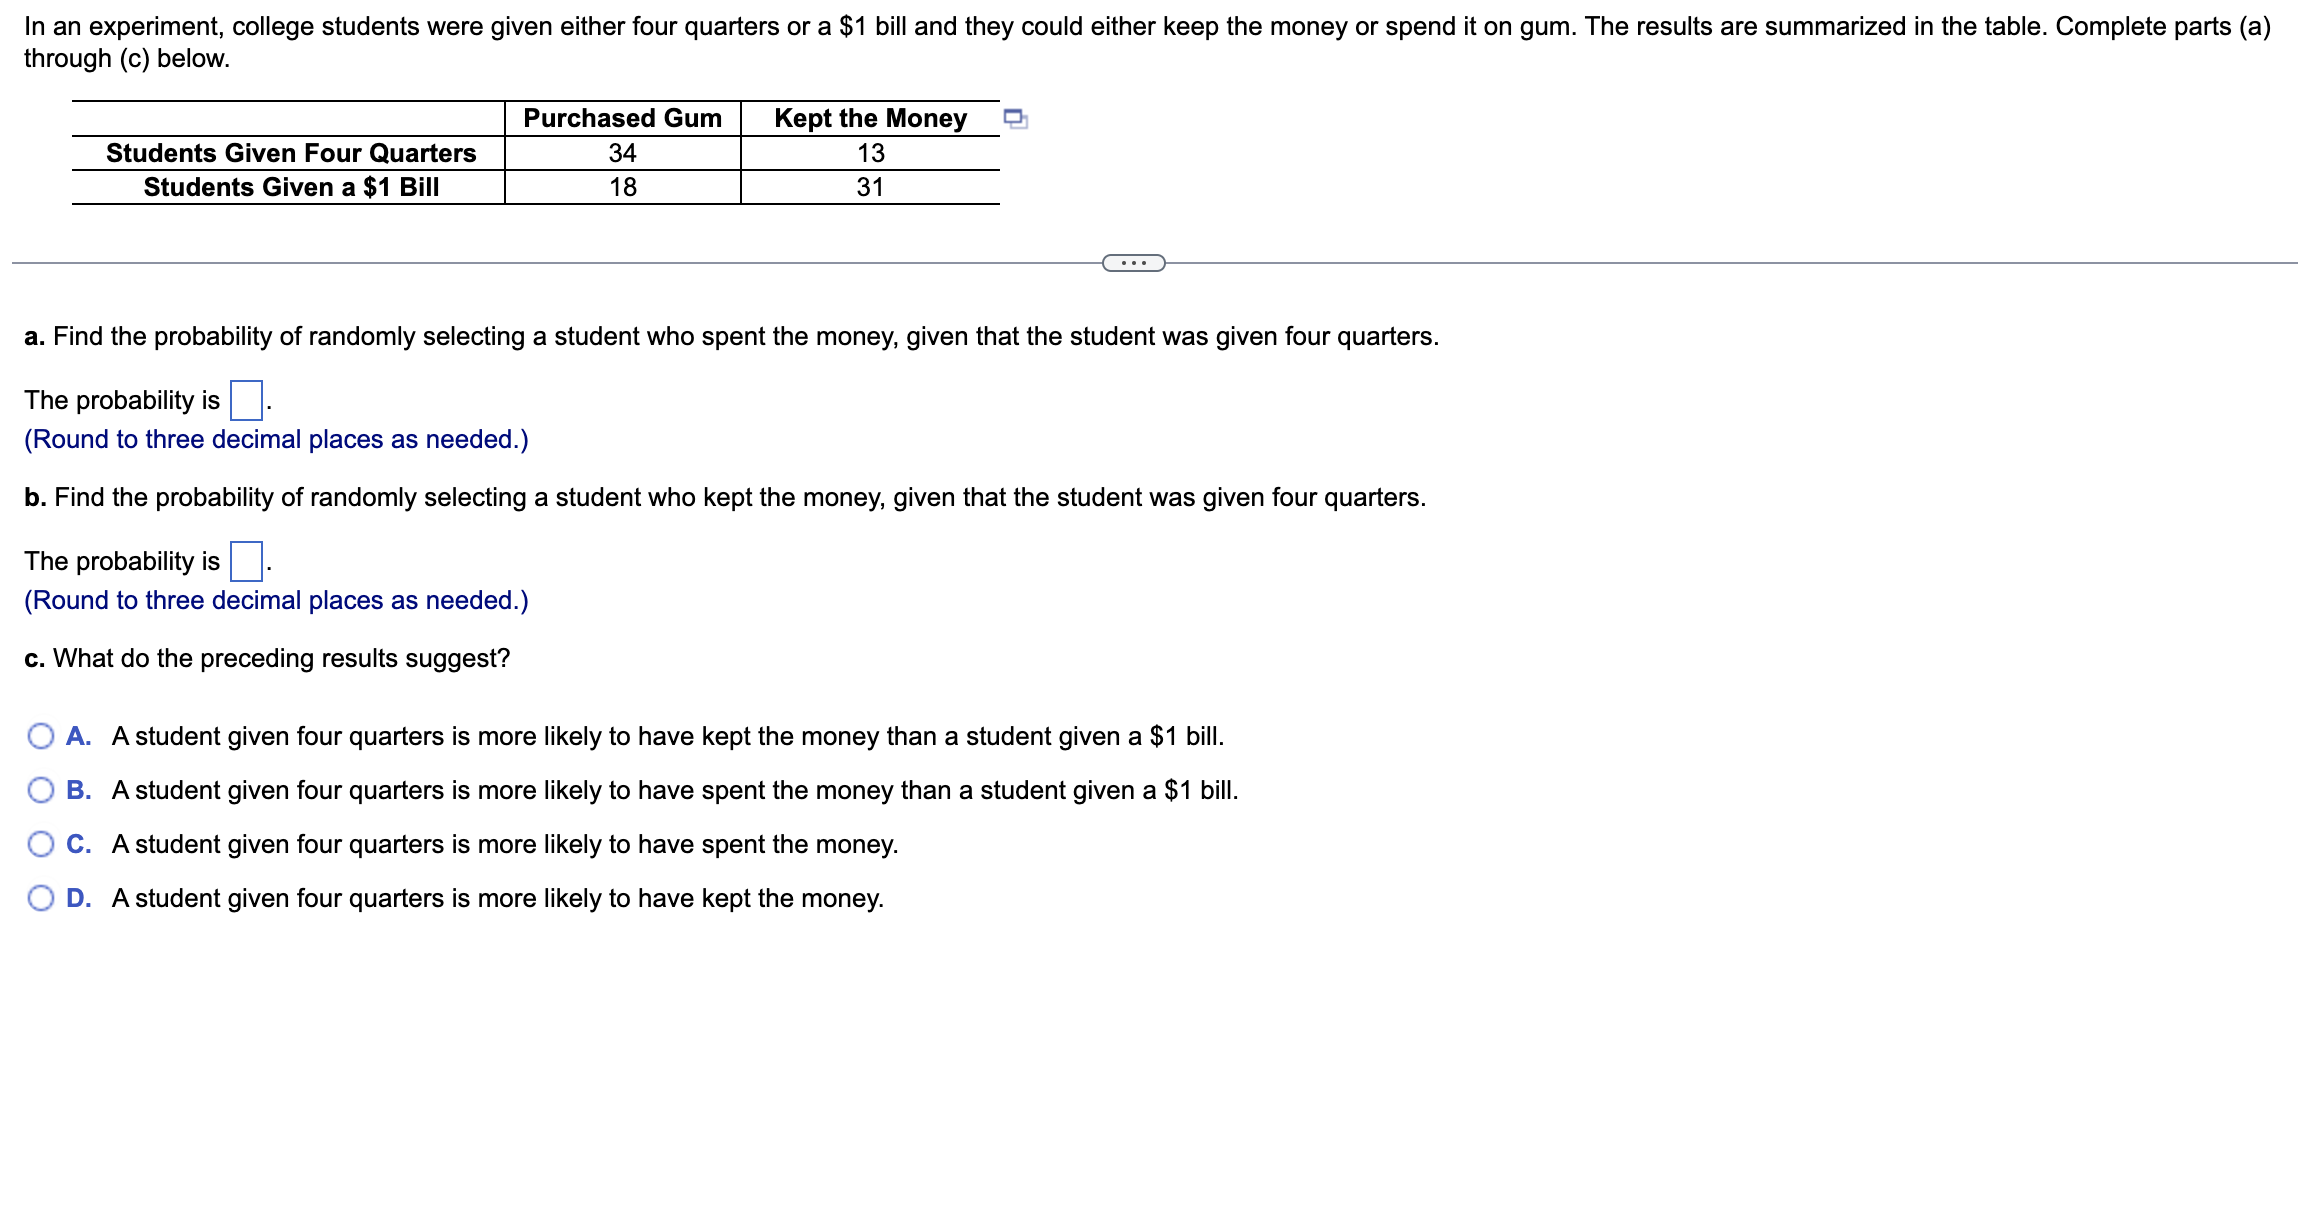
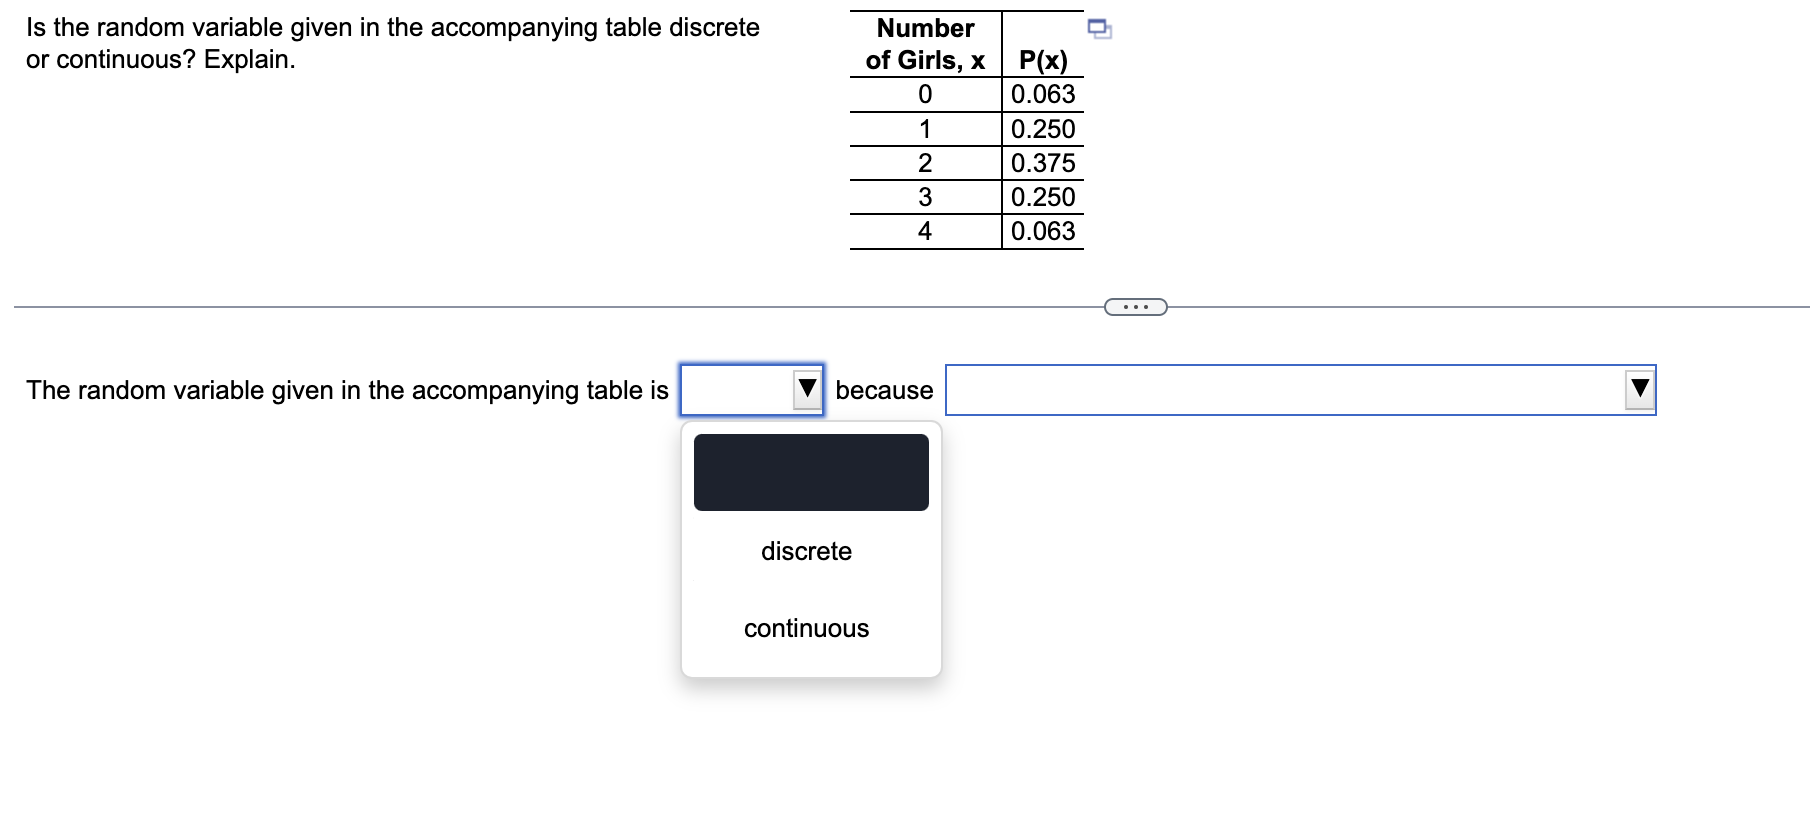
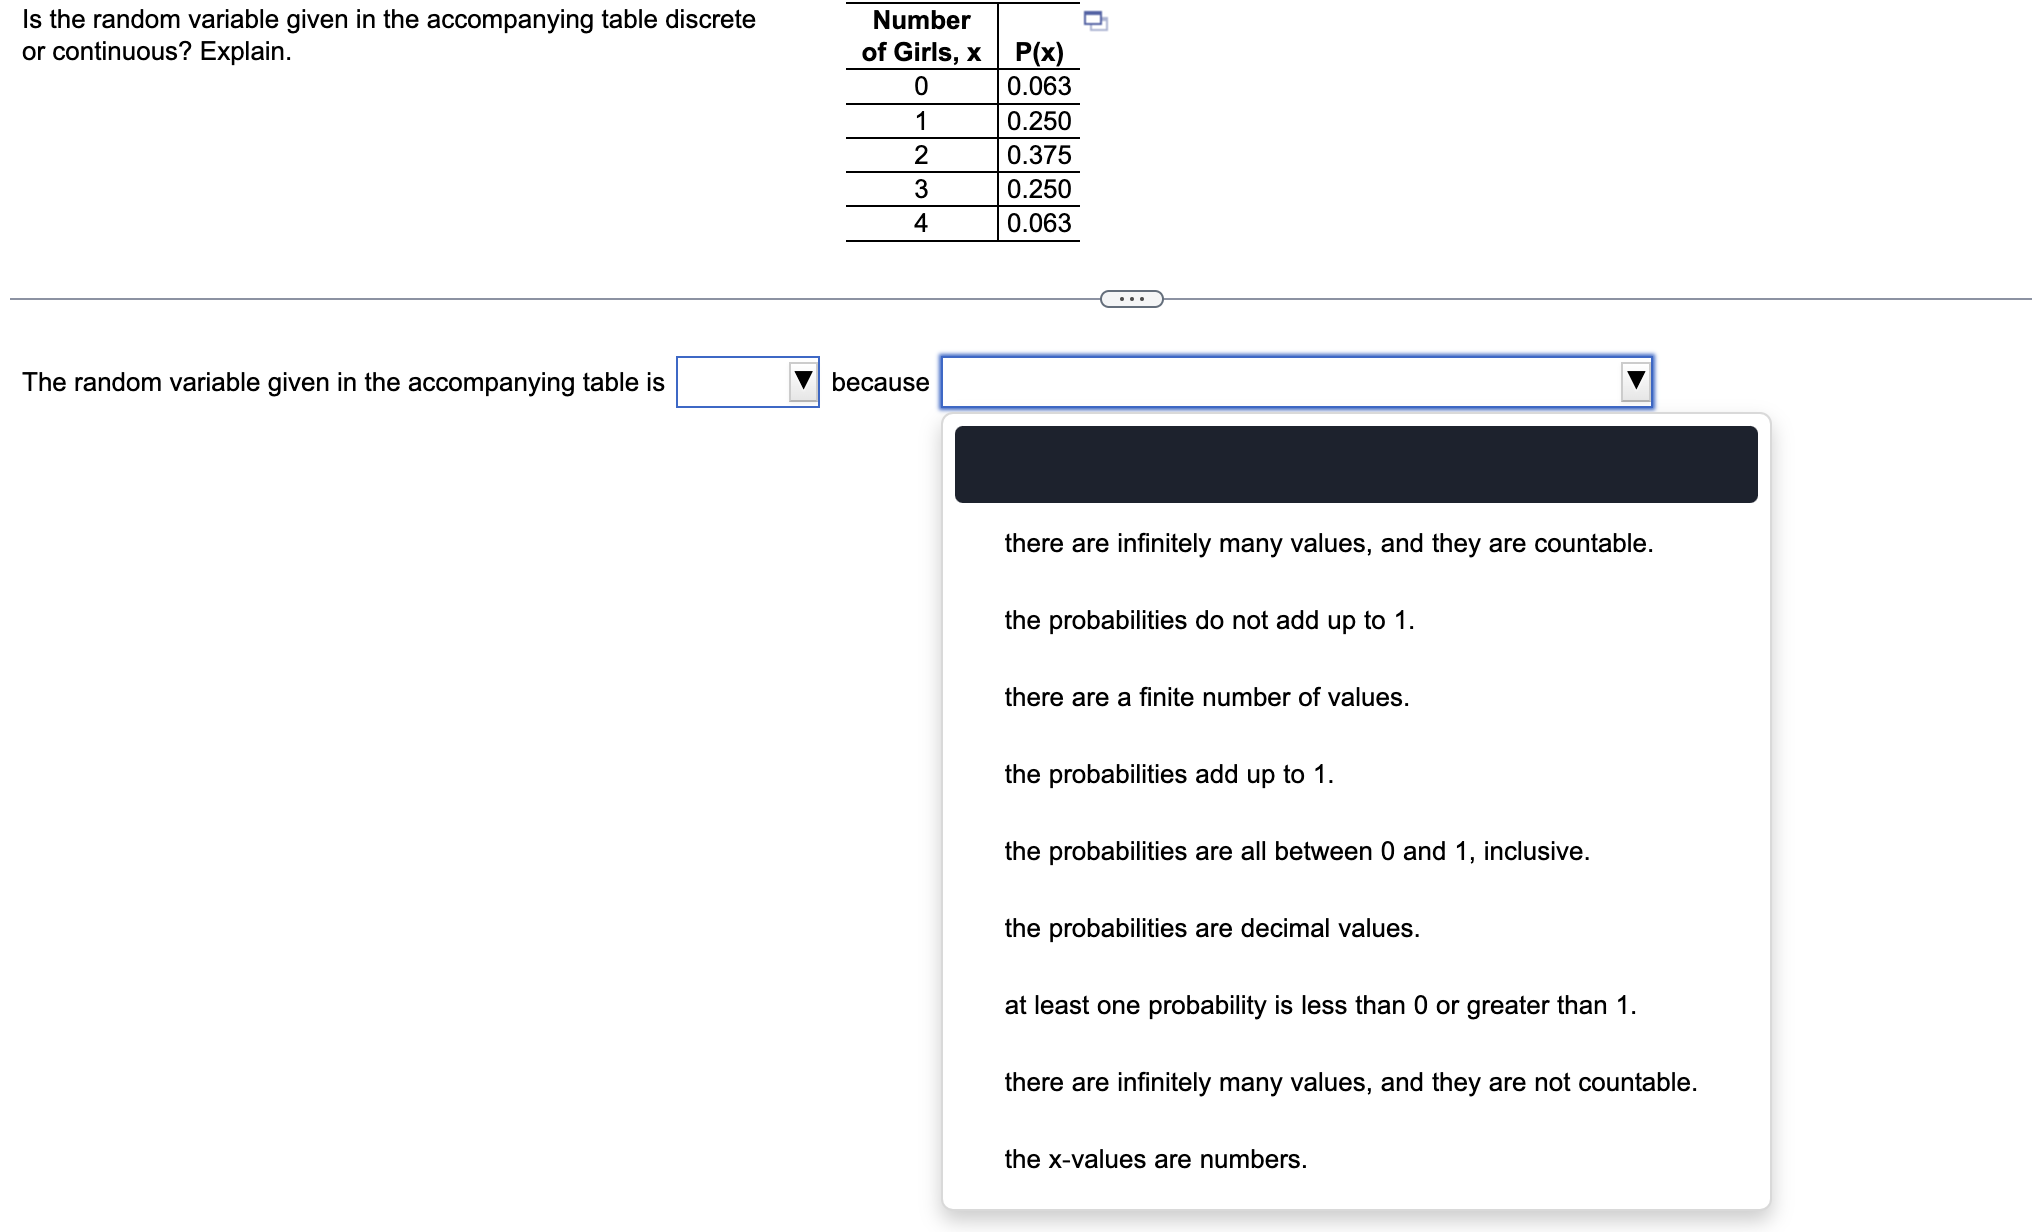
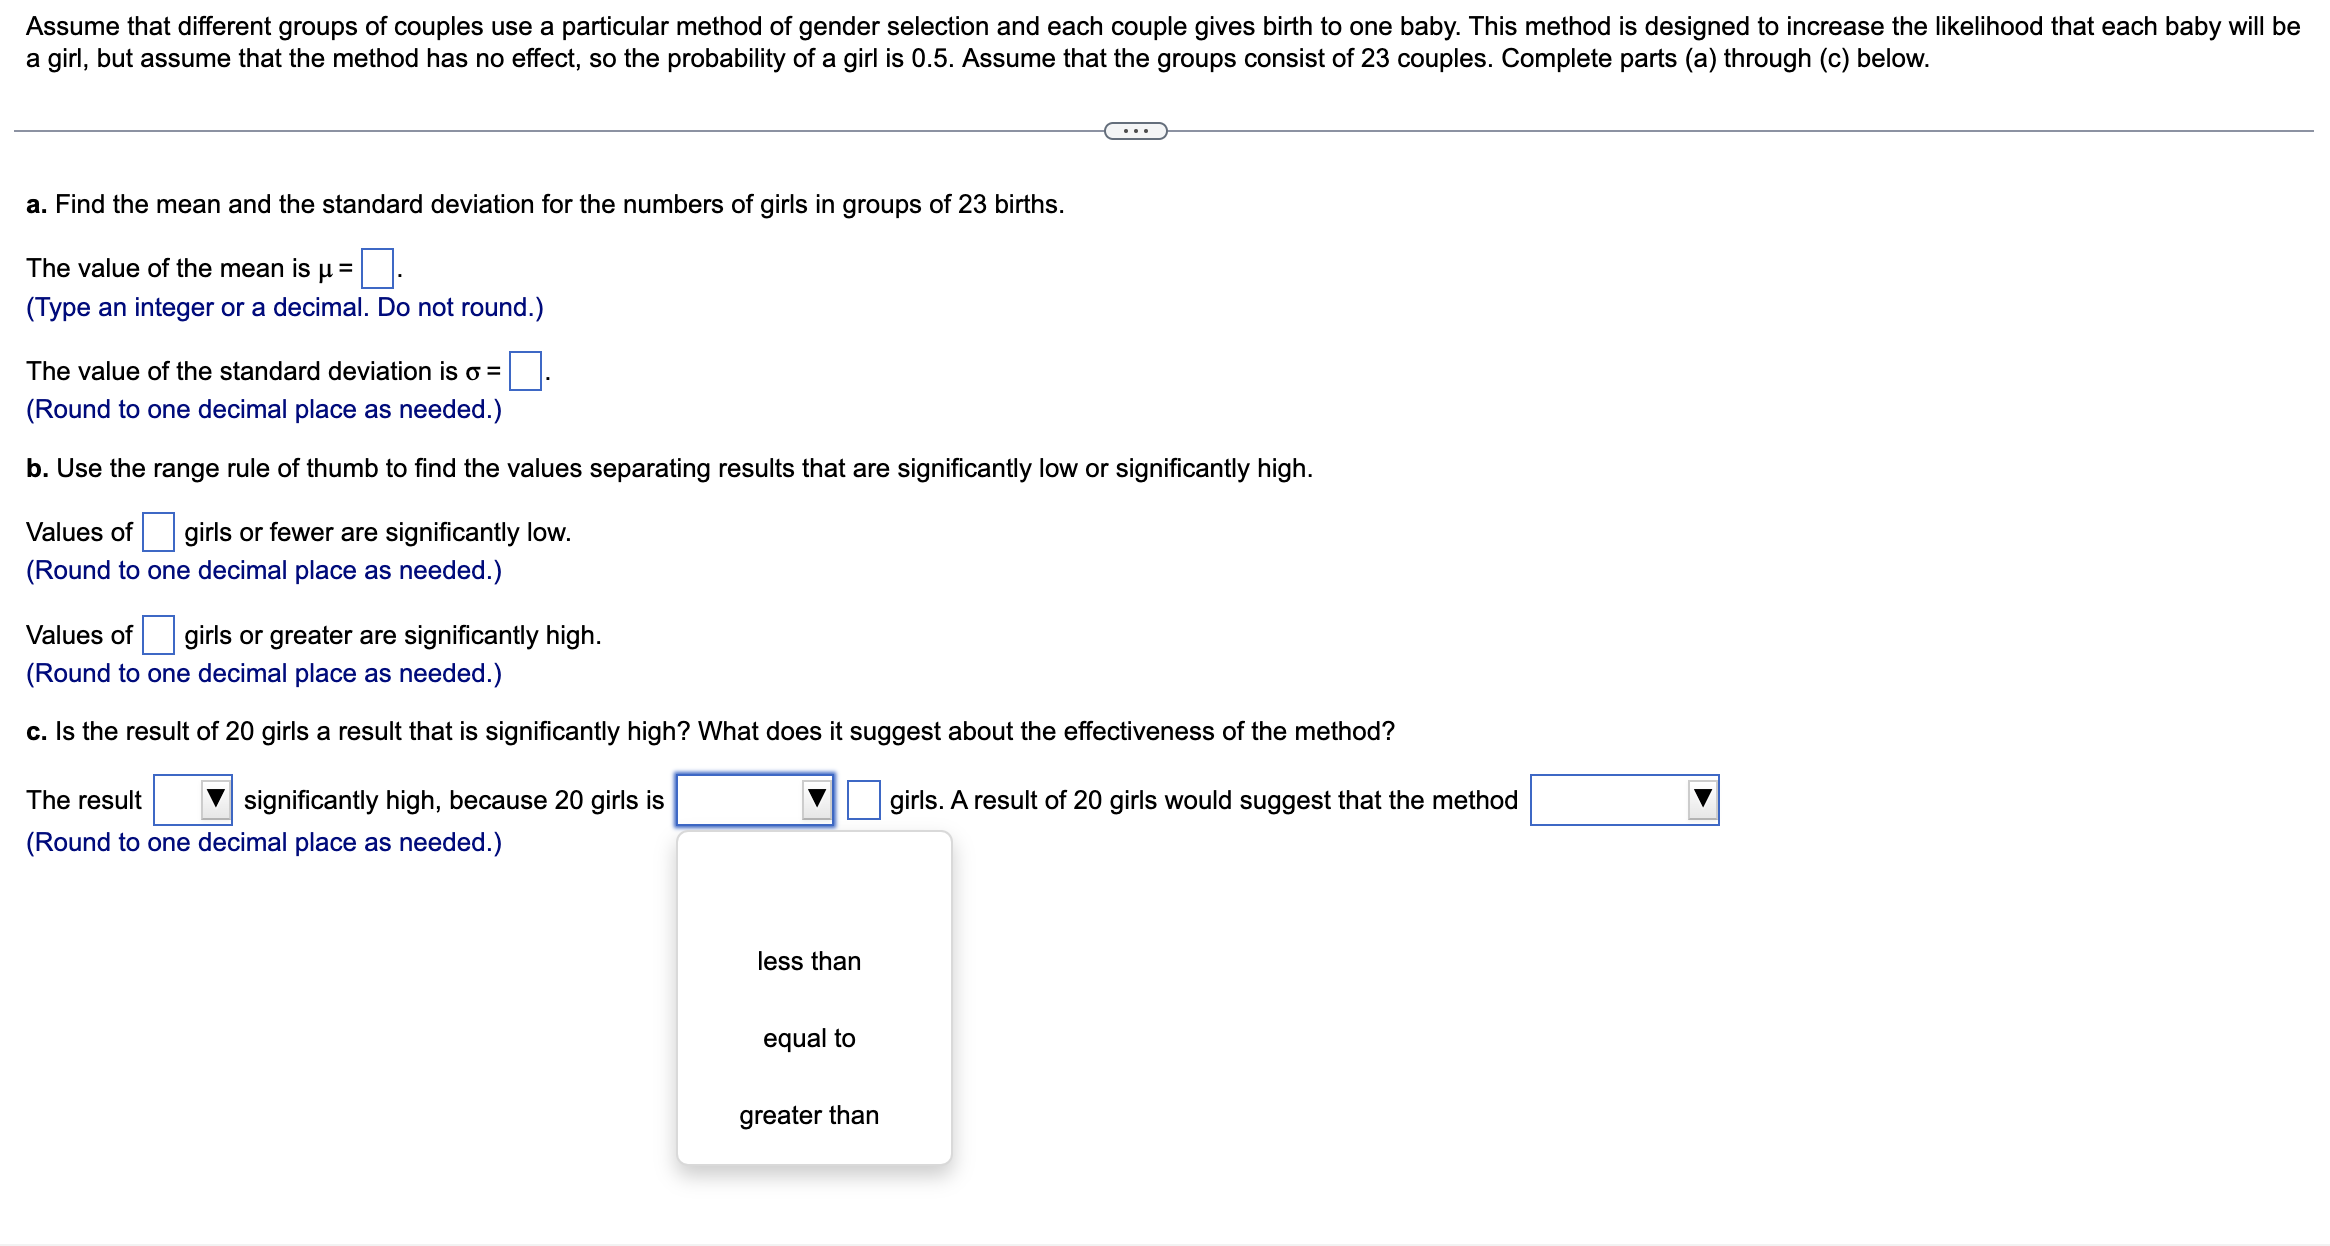
A sample of blood pressure measurements is taken for a group of adults, and those values (mm Hg) are listed below. The values are matched so that 10 subjects each have a systolic and diastolic measurement. Find the coefficient of variation for each of the two samples; then compare the variation. Systolic 119 126 159 95 157 120 118 135 124 119 Diastolic 79 76 75 50 90 8 60 64 71 84 The coefficient of variation for the systolic measurements is | |%. (Type an integer or decimal rounded to one decimal place as needed.) The coefficient of variation for the diastolic measurements is | |%. (Type an integer or decimal rounded to one decimal place as needed.) Compare the variation. The coefficients of variation for each data set are V| Therefore, the systolic measurements vary V| the diastolic measurements. Use z scores to compare the given values. The tallest living man at one time had a height of 230 cm. The shortest living man at that time had a height of 65.1 cm. Heights of men at that time had a mean of 172.59 cm and a standard deviation of 6.43 cm. Which of these two men had the height that was more extreme? Since the z score for the tallest man is z= and the z score for the shortest manis z=| |, the Ijl man had the height that was more extreme. (Round to two decimal places.) - shortest tallest The following are the ratings of men by women in an experiment involving speed dating. Use the given data to construct a boxplot and identify the 5-number summary. 1.0 2.0 25 25 25 25 3.0 3.0 3.0 3.0 3.0 4.0 5.0 6.0 6.0 6.0 6.5 6.5 7.0 7.0 __ - The 5-number summary is D D D |:| and D (Use ascending order. Type integers or decimals. Do not round.) Which boxplot below represents the data? O A. Q O B. Q H Q H1 Q 6 2 4 & & 1@ 62 1 46 & 103 Ratings Ratings Oc Q\\ O D. Q o Q H Q 6 2 4 & & 1@ 62 18 8 103 Ratings Ratings A research center poll showed that 82% of people believe that it is morally wrong to not report all income on tax returns. What is the probability that someone does not have this belief? - - The probability that someone does not believe that it is morally wrong to not report all income on tax returns is (Type an integer or a decimal.) Let event A =subject is telling the truth and event B = polygraph test indicates that the subject is lying. Use your own words to translate the notation P(B|A) into a verbal statement. oy Choose the correct option below. The probability that the polygraph indicates lying given that the subject is actually telling the truth. The probability that the polygraph indicates truthfulness given that the subject is actually telling the truth. The probability that the polygraph indicates lying given that the subject is actually lying. 9 0w The probability that the polygraph indicates truthfulness given that the subject is actually lying. In an experiment, college students were given either four quarters or a $1 bill and they could either keep the money or spend it on gum. The results are summarized in the table. Complete parts (a) through (c) below. Purchased Gum Kept the Money Students Given Four Quarters 34 13 Students Given a $1 Bill 18 31 D a. Find the probability of randomly selecting a student who spent the money, given that the student was given four quarters. The probability is | |. (Round to three decimal places as needed.) b. Find the probability of randomly selecting a student who kept the money, given that the student was given four quarters. The probability is | |. (Round to three decimal places as needed.) c. What do the preceding results suggest? . Astudent given four quarters is more likely to have kept the money than a student given a $1 bill. . Astudent given four quarters is more likely to have spent the money than a student given a $1 bill. . A student given four quarters is more likely to have spent the money. . A student given four quarters is more likely to have kept the money. Is the random variable given in the accompanying table discrete Number or continuous? Explain. of Girls, x P(x) 0 0.063 0.250 2 0.375 3 0.250 4 0.063 . . . The random variable given in the accompanying table is because discrete continuousIs the random variable given in the accompanying table discrete Number o or continuous? Explain. of Girls, x | P(x) 0 0.063 1 0.250 2 0.375 3 0.250 4 0.063 () The random variable given in the accompanying table is V| because |:' there are infinitely many values, and they are countable. the probabilities do not add up to 1. there are a finite number of values. the probabilities add up to 1. the probabilities are all between 0 and 1, inclusive. the probabilities are decimal values. at least one probability is less than 0 or greater than 1. there are infinitely many values, and they are not countable. the x-values are numbers. Assume that different groups of couples use a particular method of gender selection and each couple gives birth to one baby. This method is designed to increase the likelihood that each baby will be a girl, but assume that the method has no effect, so the probability of a girl is 0.5. Assume that the groups consist of 23 couples. Complete parts (a) through (c) below. a. Find the mean and the standard deviation for the numbers of girls in groups of 23 births. The value of the meanis p=| |. (Type an integer or a decimal. Do not round.) The value of the standard deviation is 6 = (Round to one decimal place as needed.) b. Use the range rule of thumb to find the values separating results that are significantly low or significantly high. Values of girls or fewer are significantly low. (Round to one decimal place as needed.) Values of | | girls or greater are significantly high. (Round to one decimal place as needed.) c. Is the result of 20 girls a result that is significantly high? What does it suggest about the effectiveness of the method? The result Ij\\ significantly high, because 20 girls is ':I girls. A result of 20 girls would suggest that the method Ij (Round to one decimal place as needed.) less than equal to greater than
Step by Step Solution
There are 3 Steps involved in it
Step: 1
Get Instant Access to Expert-Tailored Solutions
See step-by-step solutions with expert insights and AI powered tools for academic success
Step: 2
Step: 3
Ace Your Homework with AI
Get the answers you need in no time with our AI-driven, step-by-step assistance