

Answered step by step
Verified Expert Solution
Question
1 Approved Answer
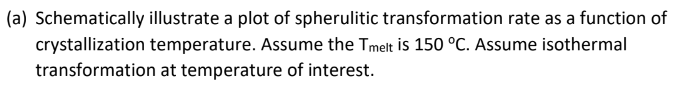
(a) Schematically illustrate a plot of spherulitic transformation rate as a function of crystallization temperature. Assume the Tmelt is 150C. Assume isothermal transformation at temperature
Step by Step Solution
There are 3 Steps involved in it
Step: 1

Get Instant Access to Expert-Tailored Solutions
See step-by-step solutions with expert insights and AI powered tools for academic success
Step: 2

Step: 3
Ace Your Homework with AI
Get the answers you need in no time with our AI-driven, step-by-step assistance
Get Started
Introduction To Chemical Engineering Thermodynamics
Authors: Hendrick C. Ness, H.C.Van, Van Ness
4th International Edition