Answered step by step
Verified Expert Solution
Question
1 Approved Answer
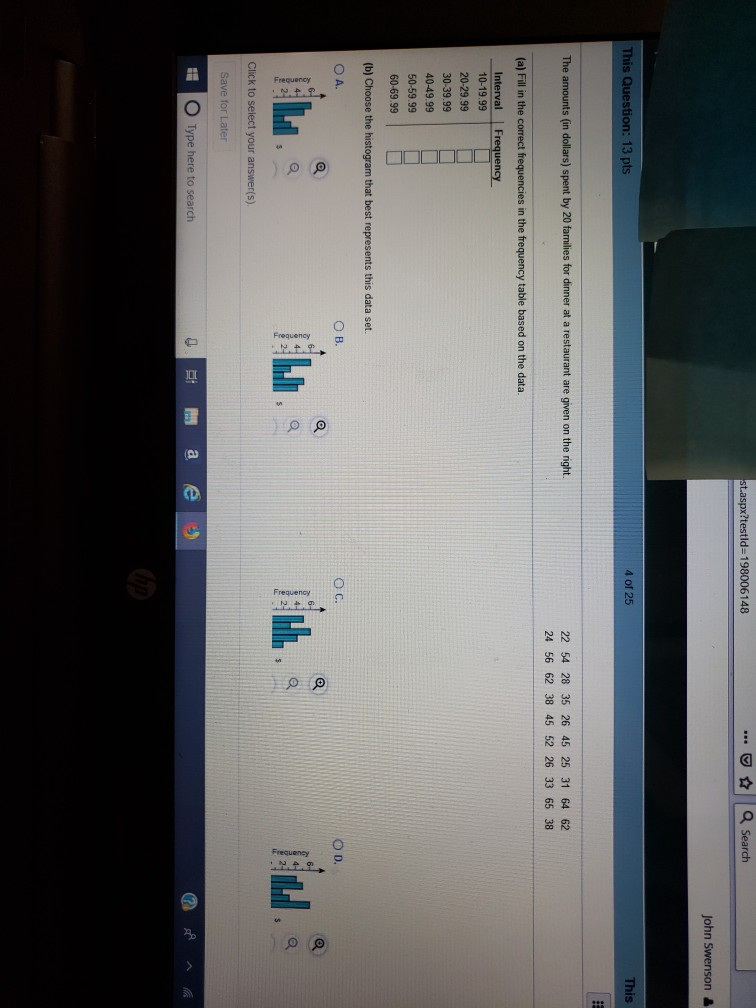
| | a search ld-198006148 ?testl John Swenson& This 4 of 25 This Question: 13 pts 22 54 28 35 26 45 25 31 64

| | a search ld-198006148 ?testl John Swenson& This 4 of 25 This Question: 13 pts 22 54 28 35 26 45 25 31 64 62 24 56 62 38 45 52 26 33 65 38 The amounts (in dollars) spent by 20 families for dinner at a restaurant are given on the right. Interval |Frequency 10-19.99 20-29.99 30-39.99 4049.99 50-59.99 60-69.99 (b) Choose the histogram that best represents this data set. O c. O D. OA. Click to select your answer(s) Type here to search
Step by Step Solution
There are 3 Steps involved in it
Step: 1

Get Instant Access to Expert-Tailored Solutions
See step-by-step solutions with expert insights and AI powered tools for academic success
Step: 2

Step: 3

Ace Your Homework with AI
Get the answers you need in no time with our AI-driven, step-by-step assistance
Get Started


